Conjoint Preference Share Simulator
Conjointly allows you to simulate shares of preference for different market offerings. Specifically, you need to describe offerings that are available on the market in the language of the attributes and levels that you chose to include in the study, and the system will estimate the percentages of preferences for these offerings. Please keep in mind that:
If you would like to test out a new product, add it to the list of existing concepts.
If two or more offerings share exactly the same levels, input each offering separately. For example, if there are two brands each offering identical products, put in both brands in two separate lines.
Preference shares only approximate market shares due to factors such as availability of products (e.g., not available in all geographies), shelf space (in case of FMCG).
Automated preference share simulations for what-if scenarios
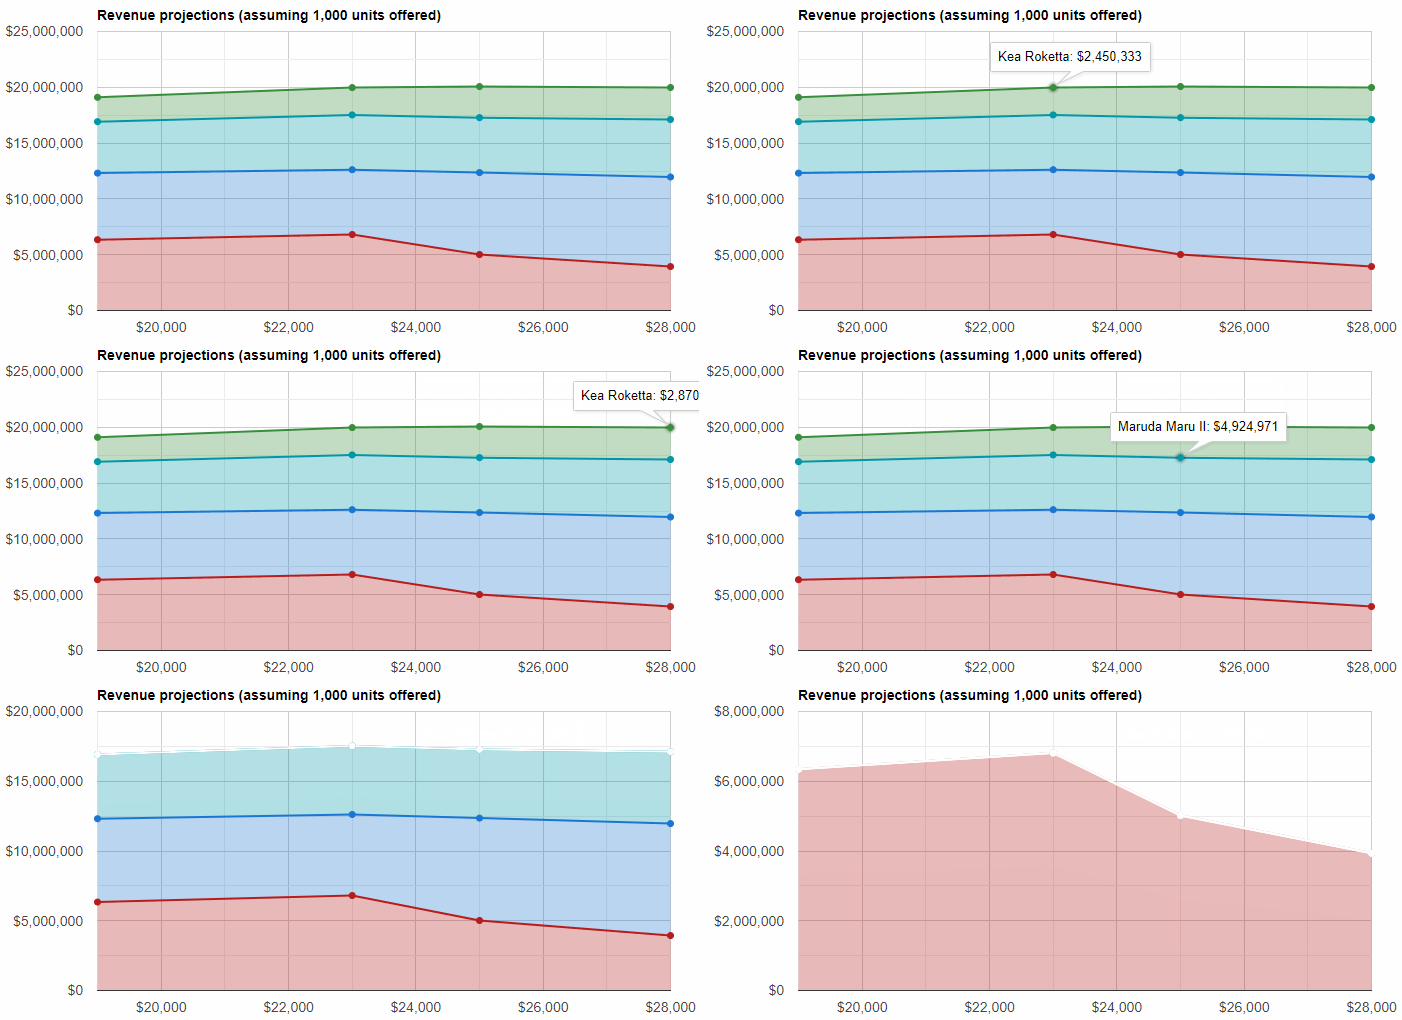
Brand Specific Conjoint and other types of experiments provide outputs allowing estimation of preference shares, revenue projections and price elasticity for specific market scenarios.
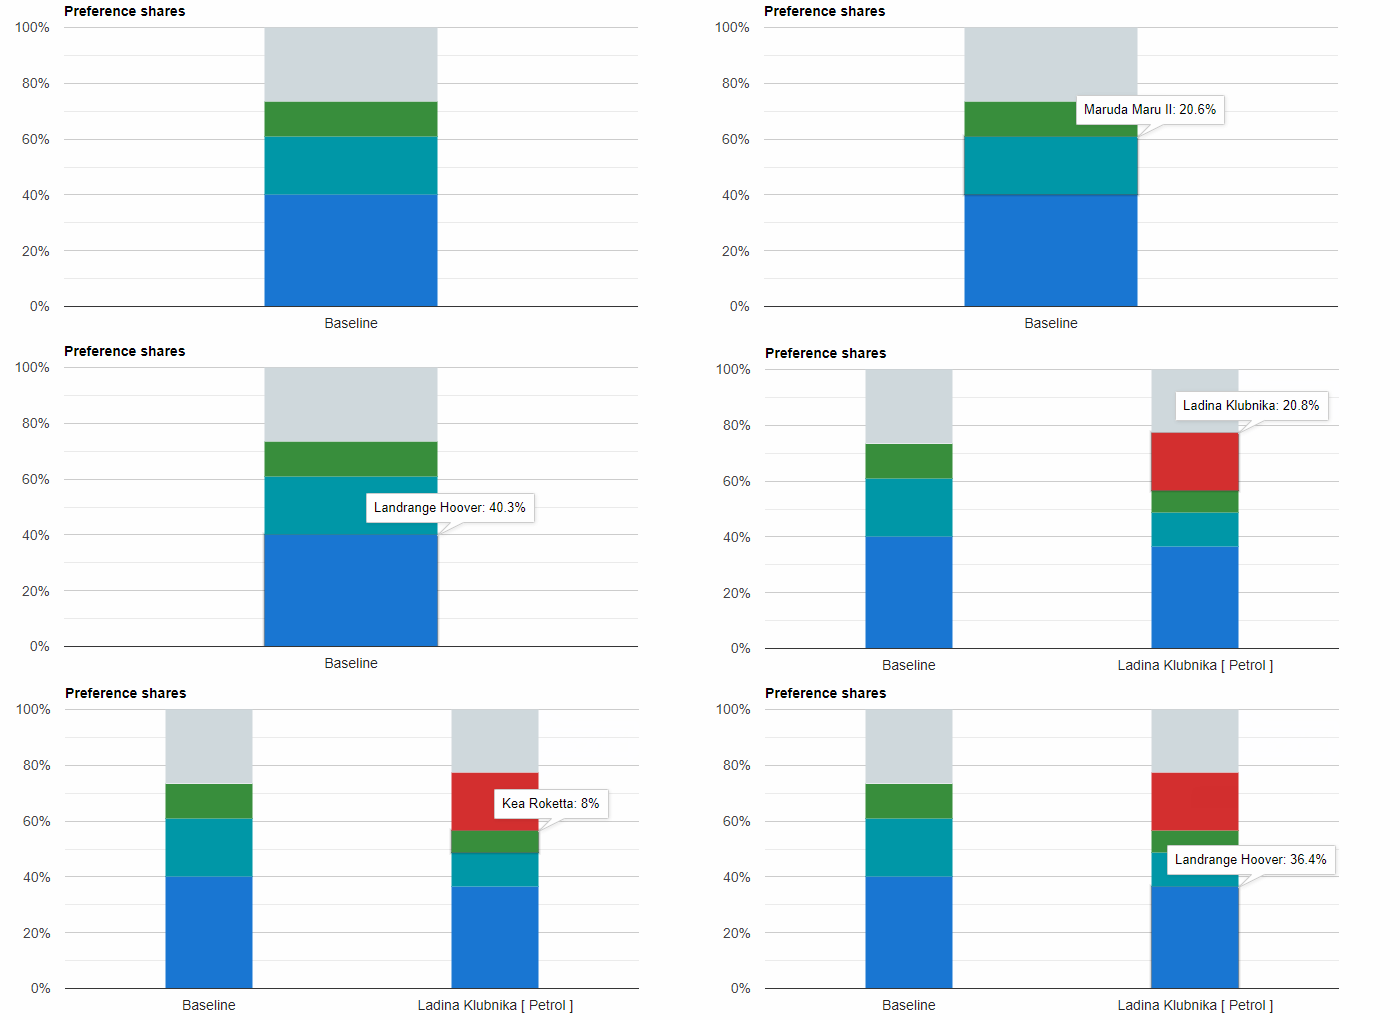
Below are the predictions for a baseline scenario of four car brands:
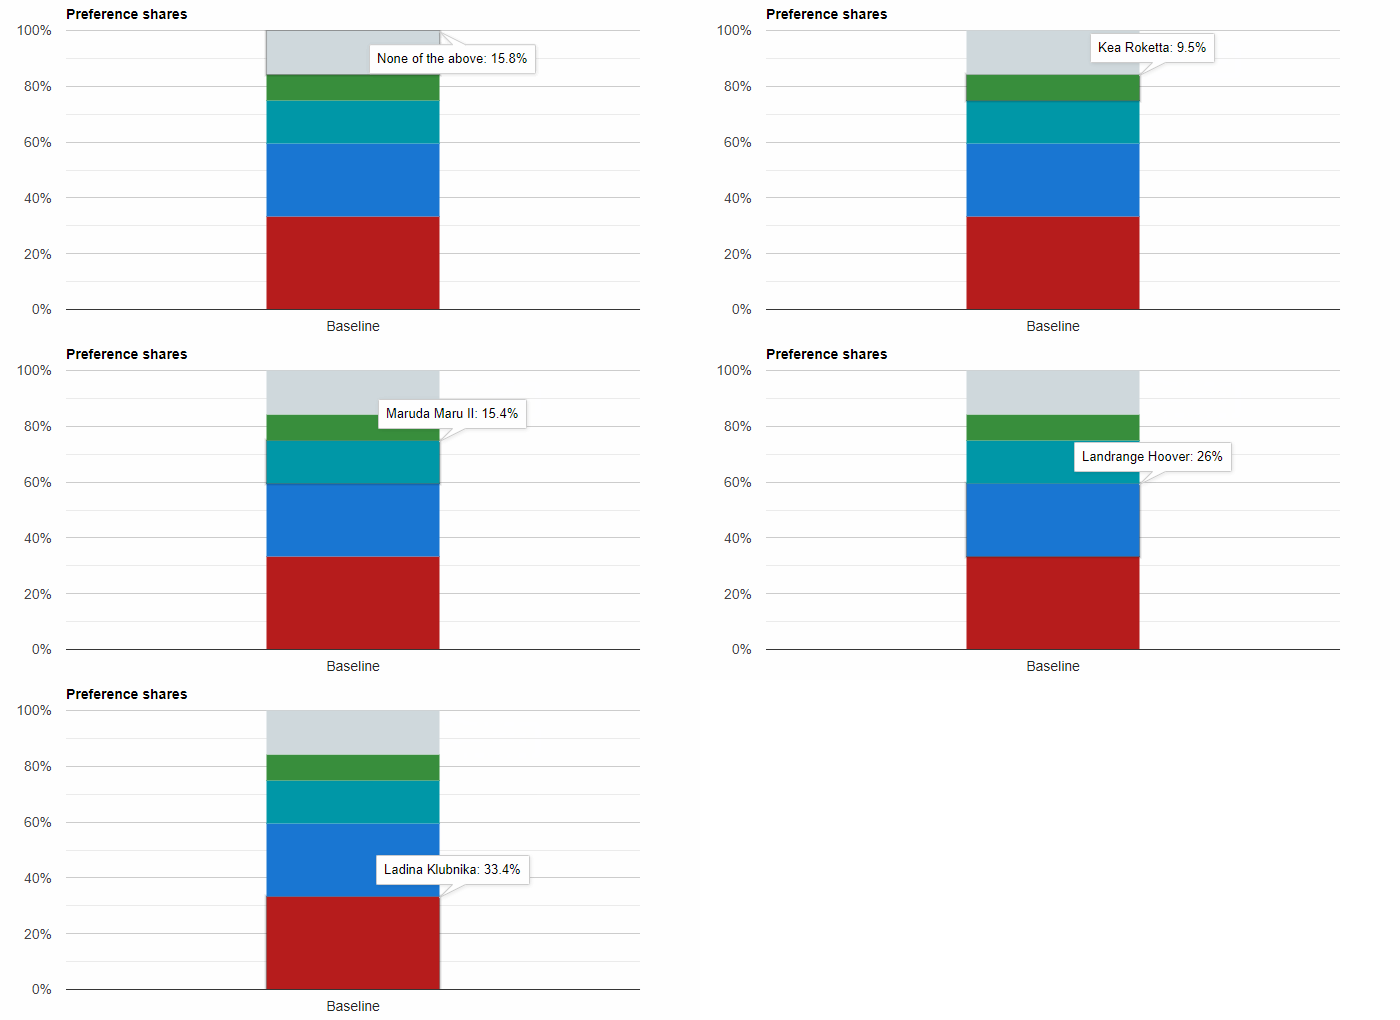
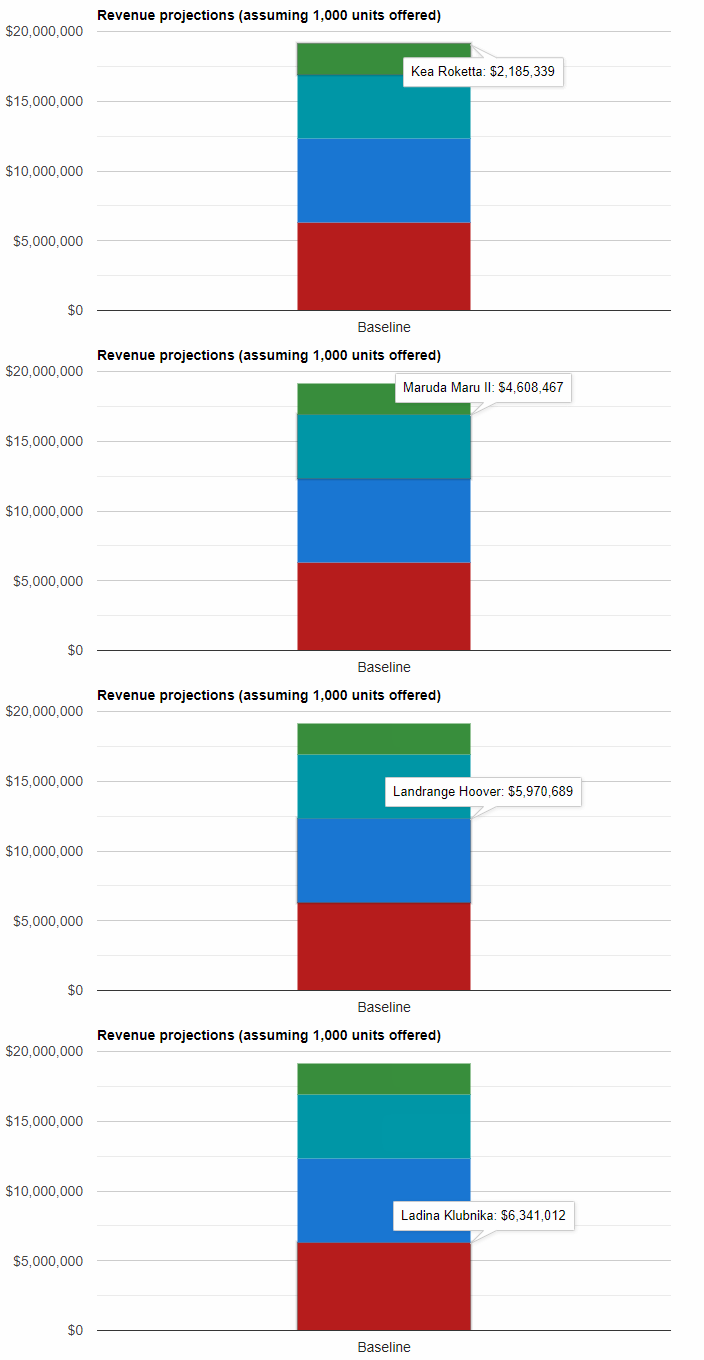
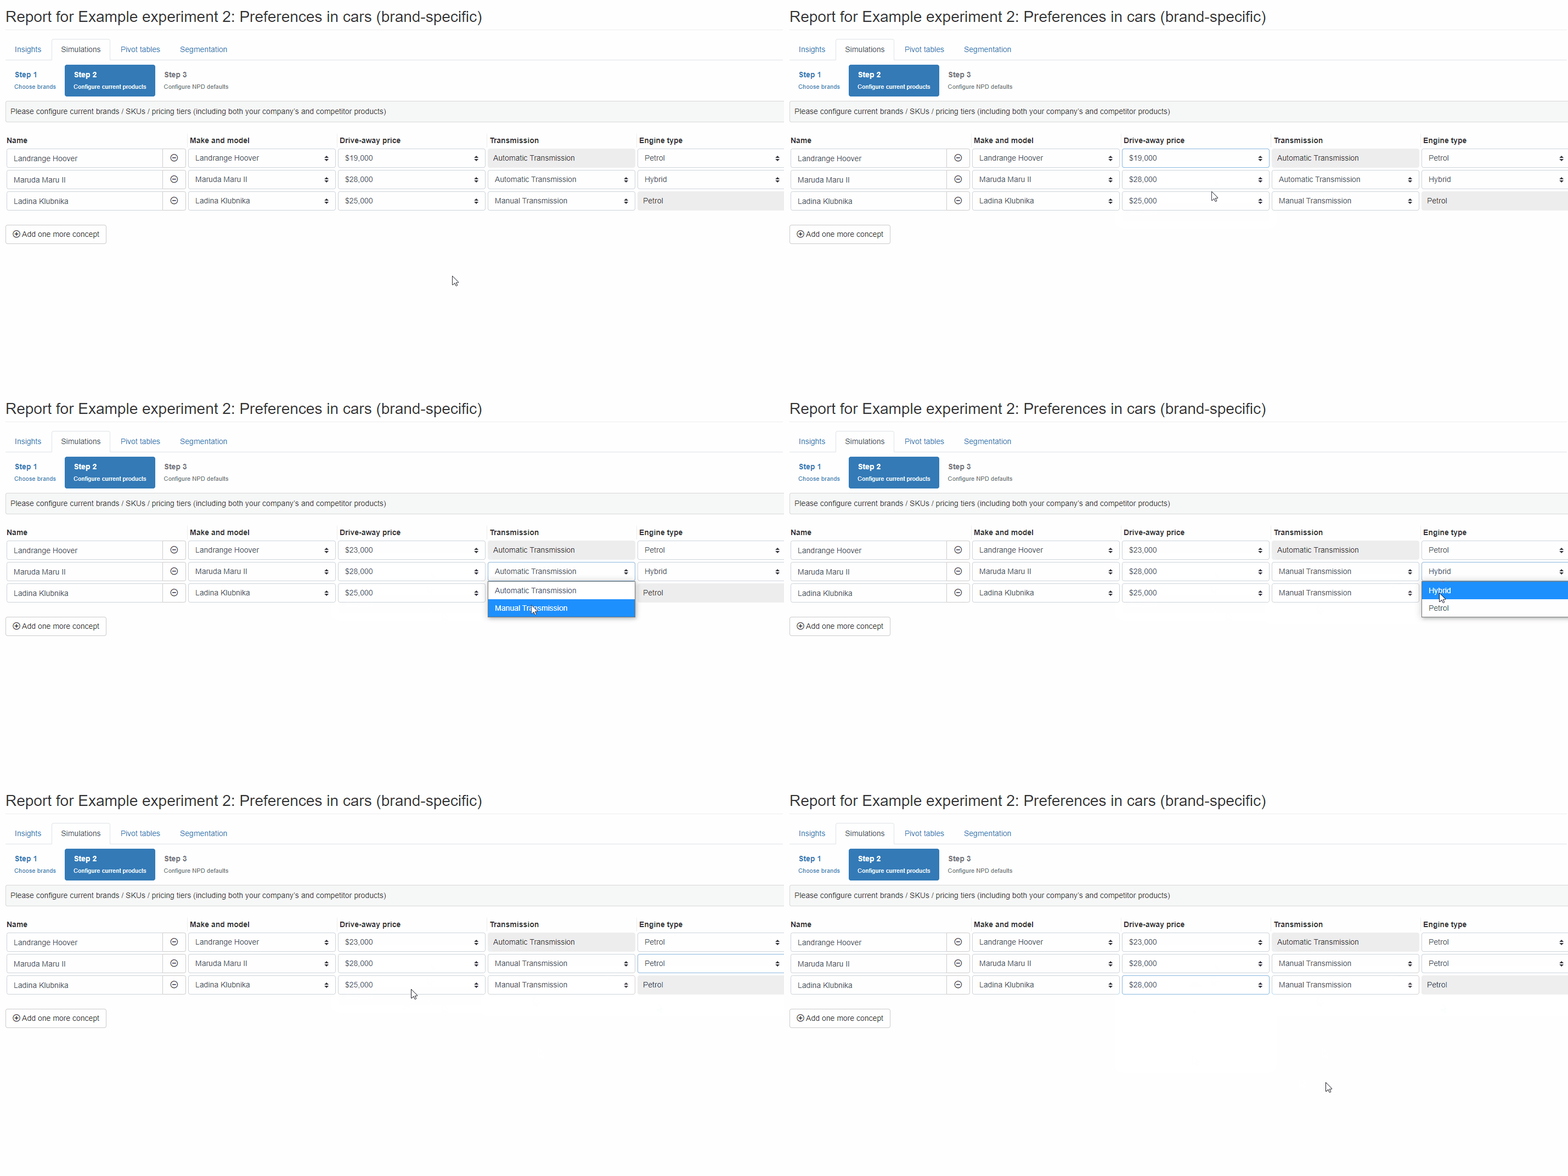
This baseline assumes the following features of the four car models:
| Make and model | Drive-away price | Transmission | Engine type |
|---|---|---|---|
Feature selection
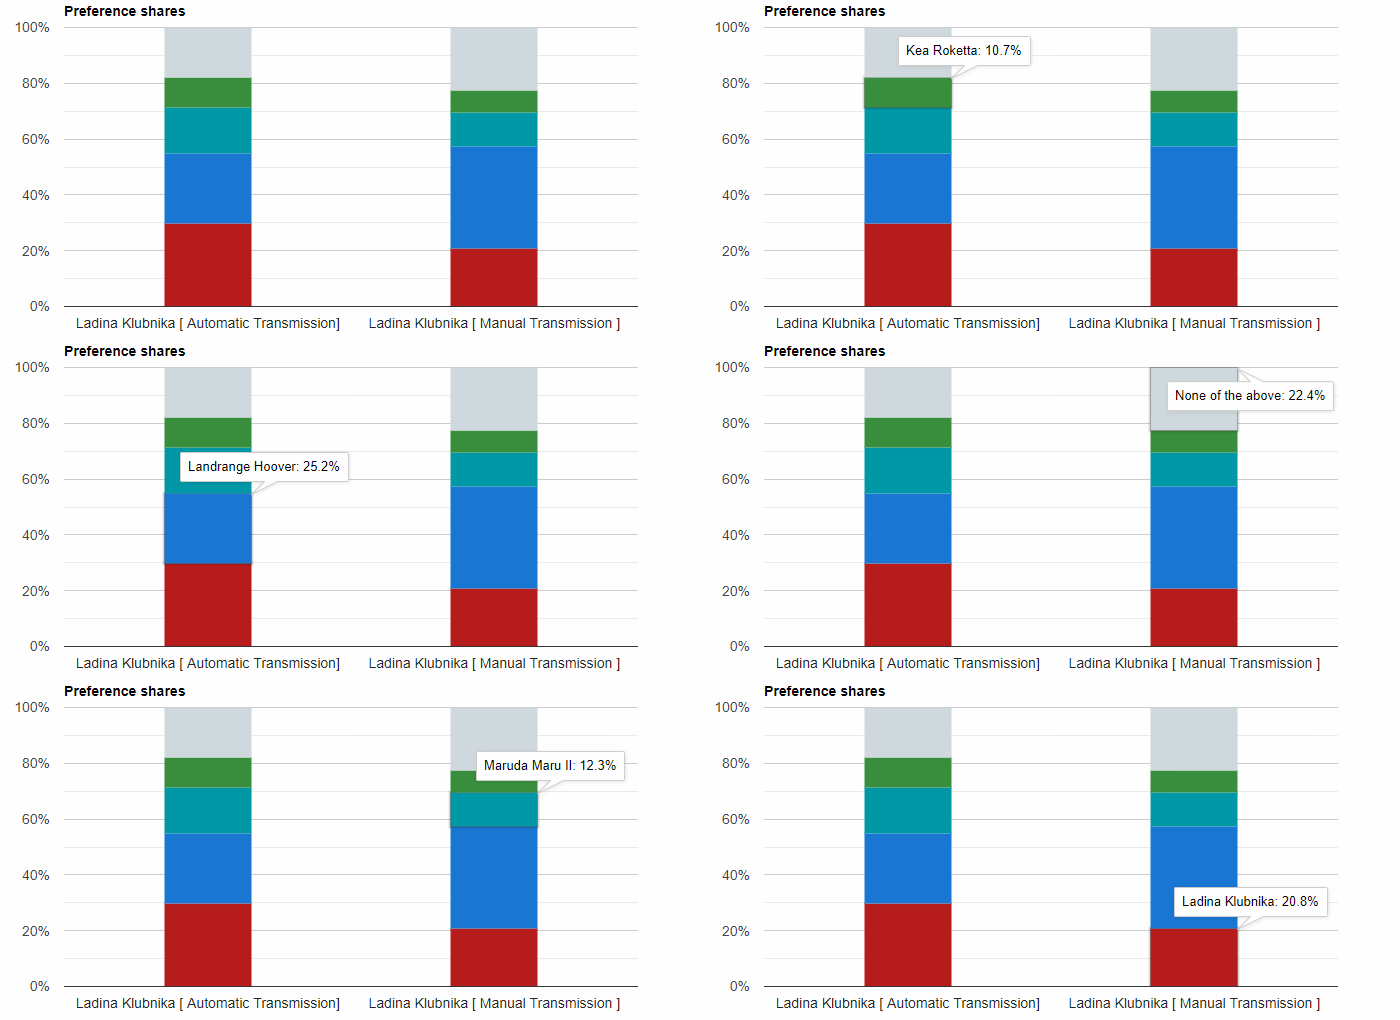
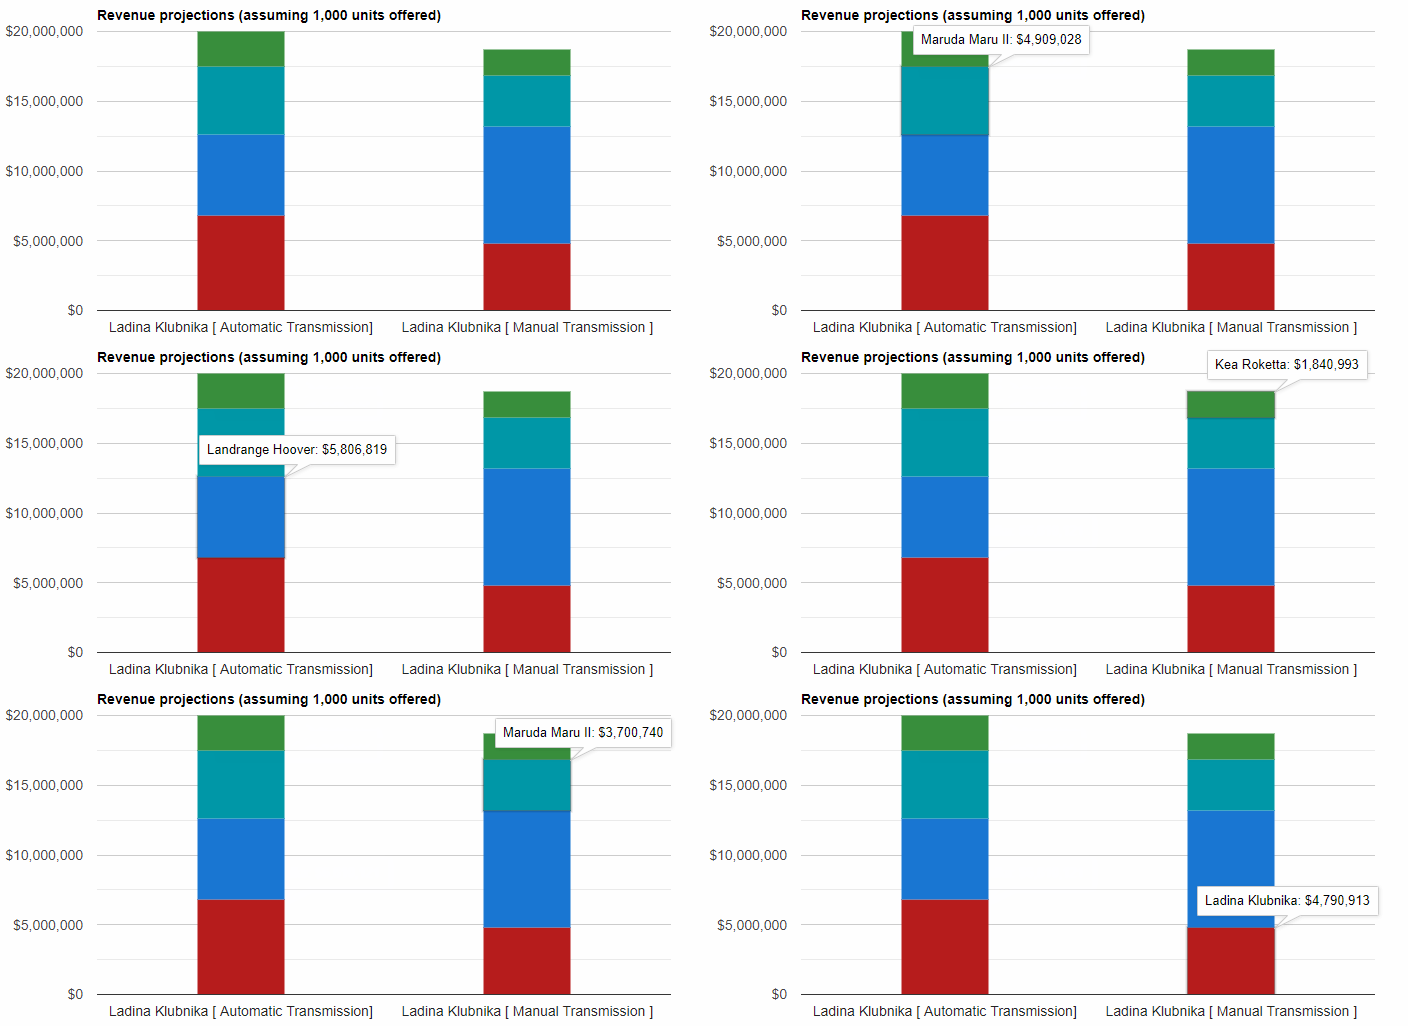
Now that we have established a baseline, we can check what happens if we change the attribute of Transmission from Automatic to Manual for the Ladina Klubnika model:
Price elasticity of demand in two clicks
Price elasticity of demand can be calculated for multiple scenarios by clicking on two points of a preference share simulation.
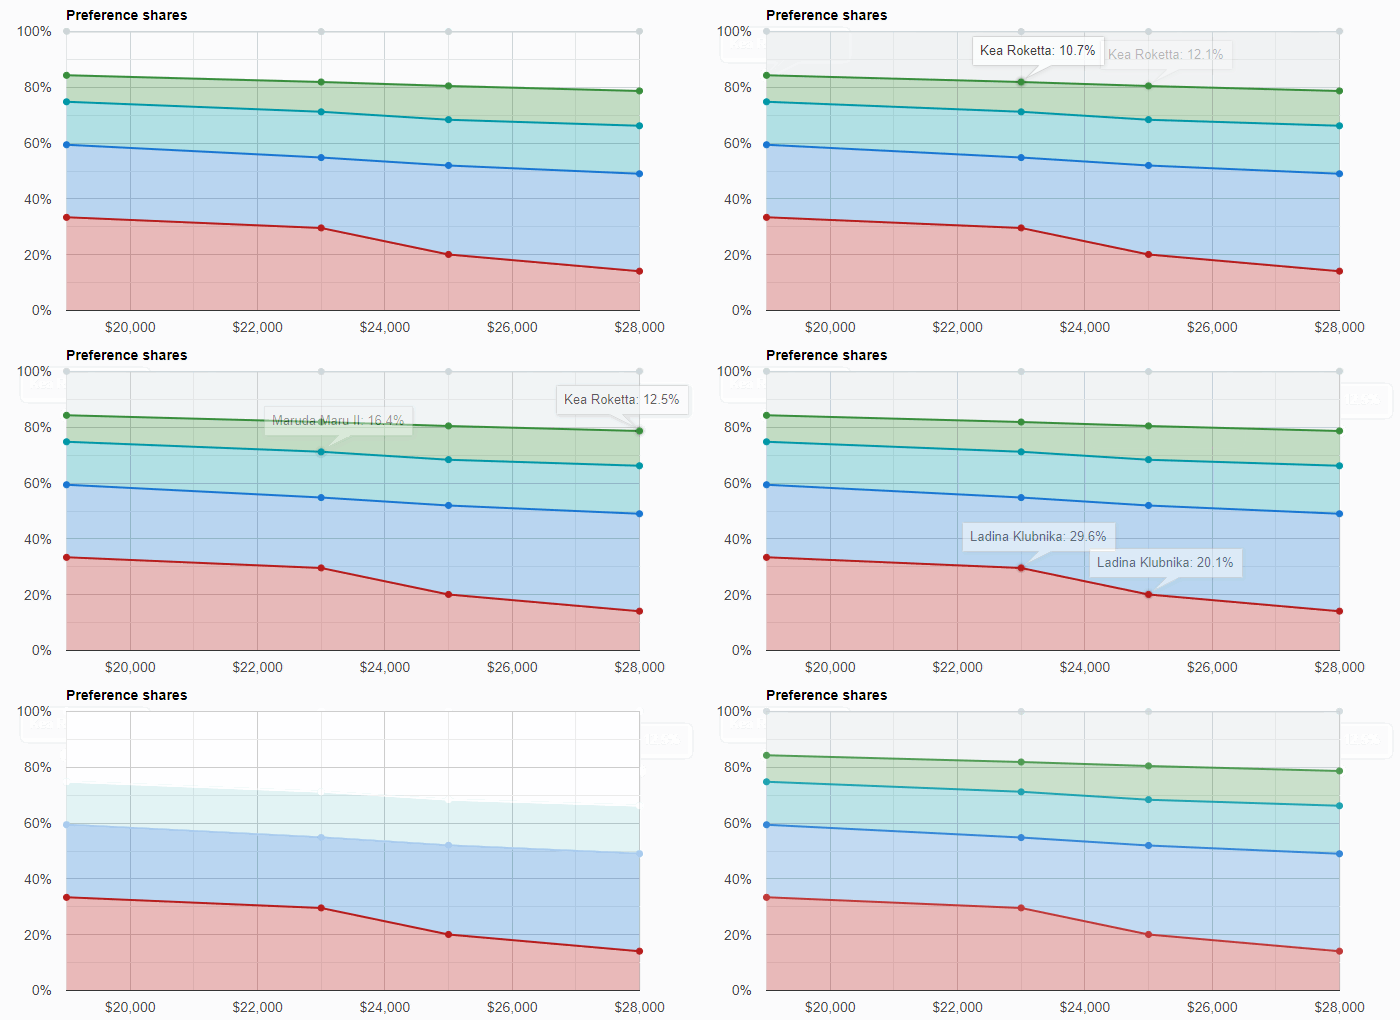
In this scenario, when clicking on both the $23,000 and $25,000 price points for Ladina Klubnika a message will be displayed stating that the price elasticity of demand is elastic.
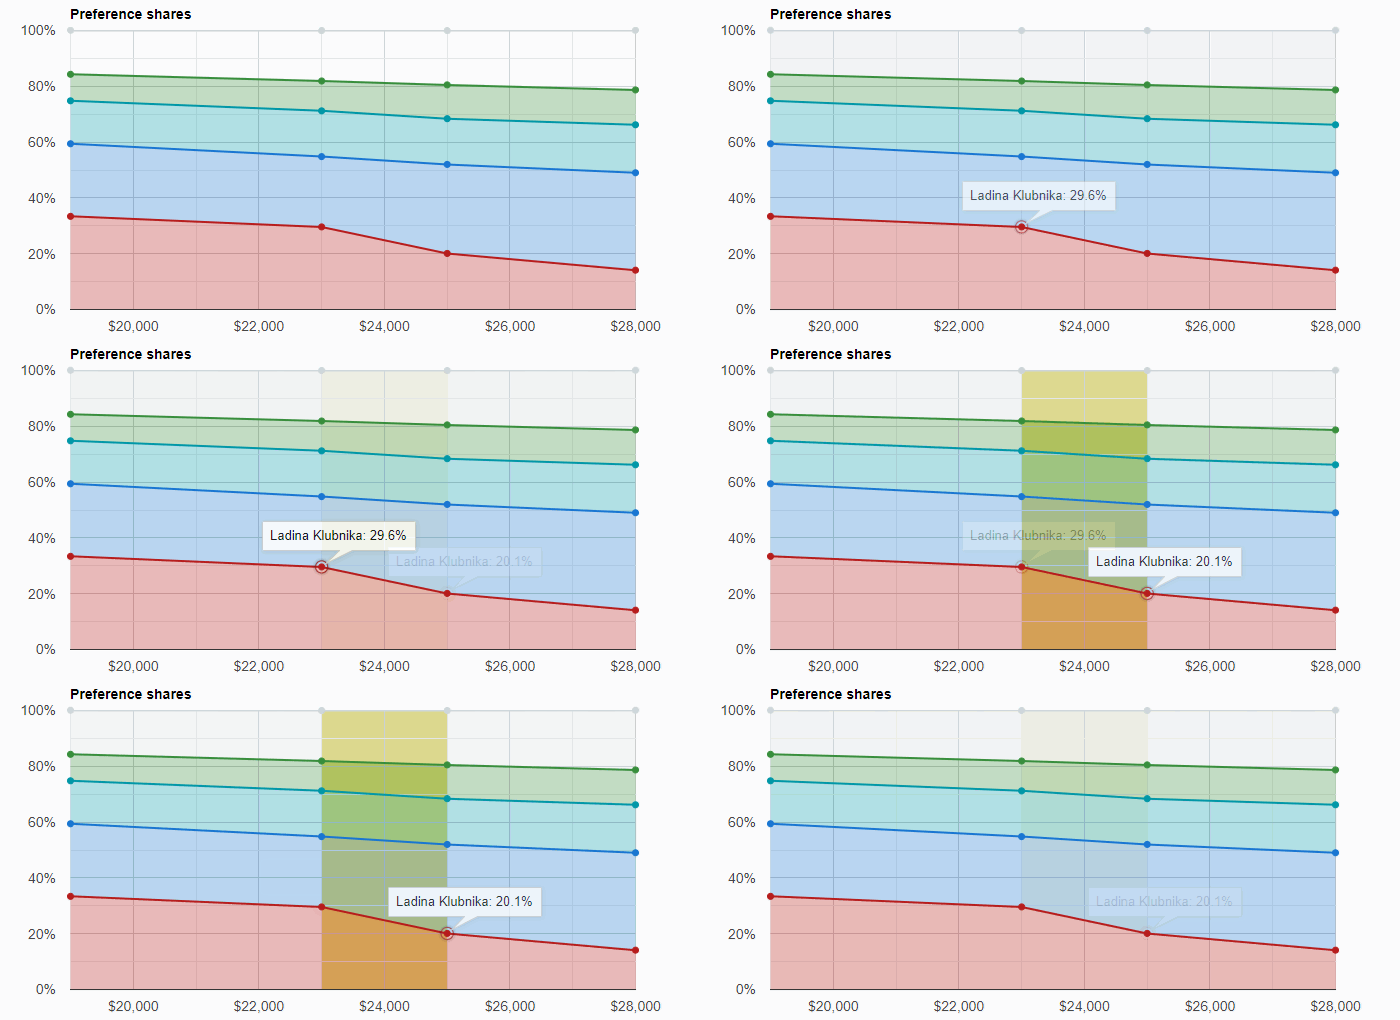
Ladina Klubnika
Price elasticity of demand between $23,000 and $25,000 is -4.6.
Demand is elastic (i.e., an increase in price by 1% leads to more than 1% drop in volume).
New product launch simulations
New product launches (NPDs) can be simulated to see redistribution of preference and revenue shares.
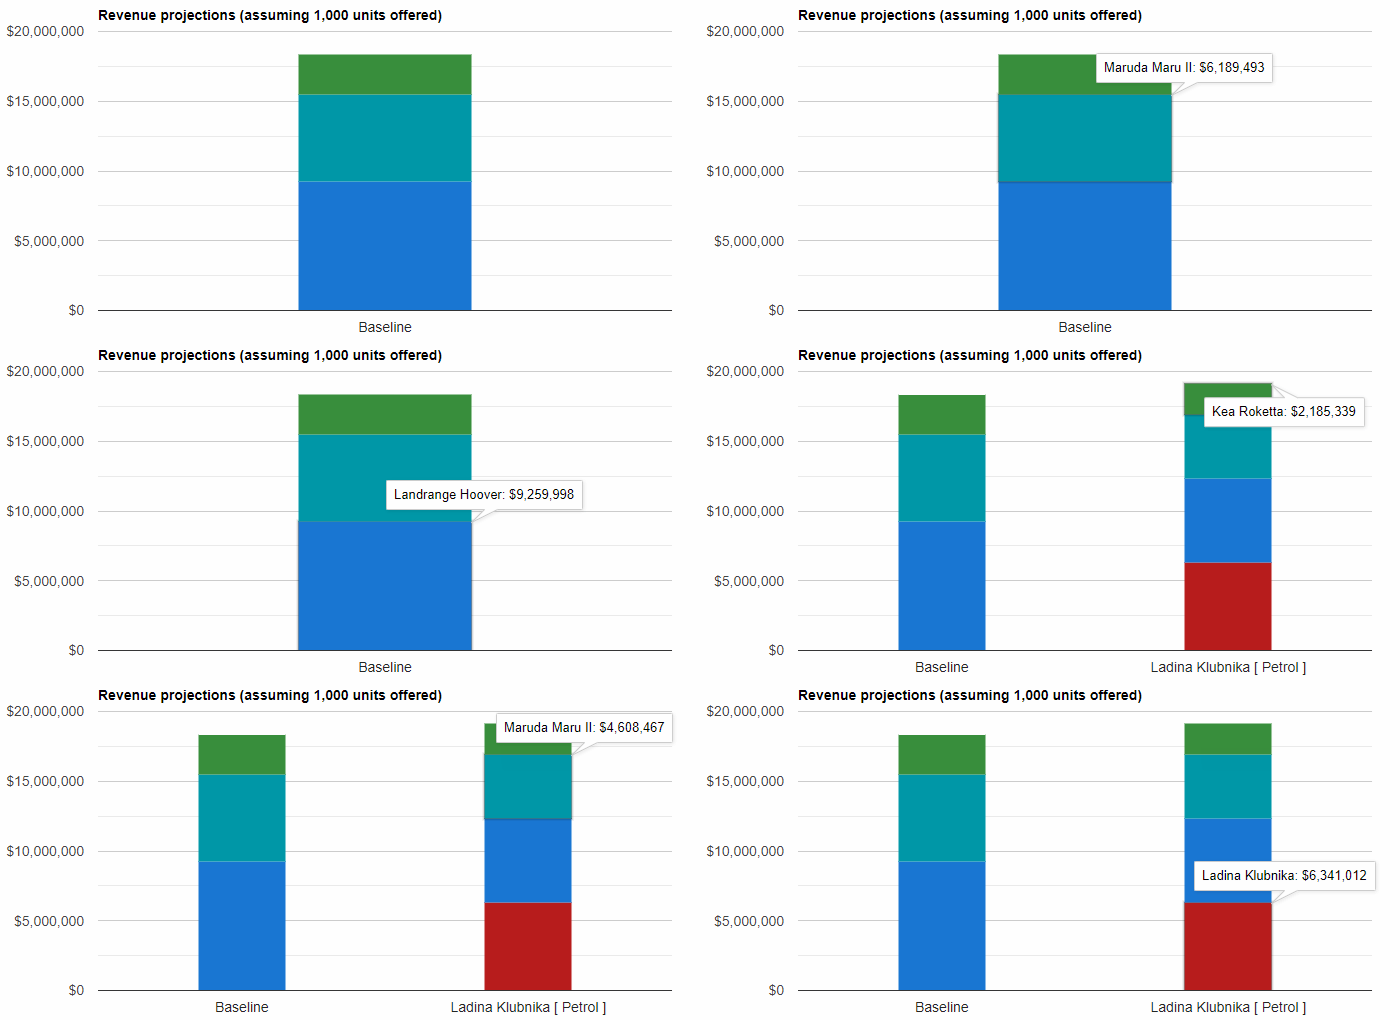
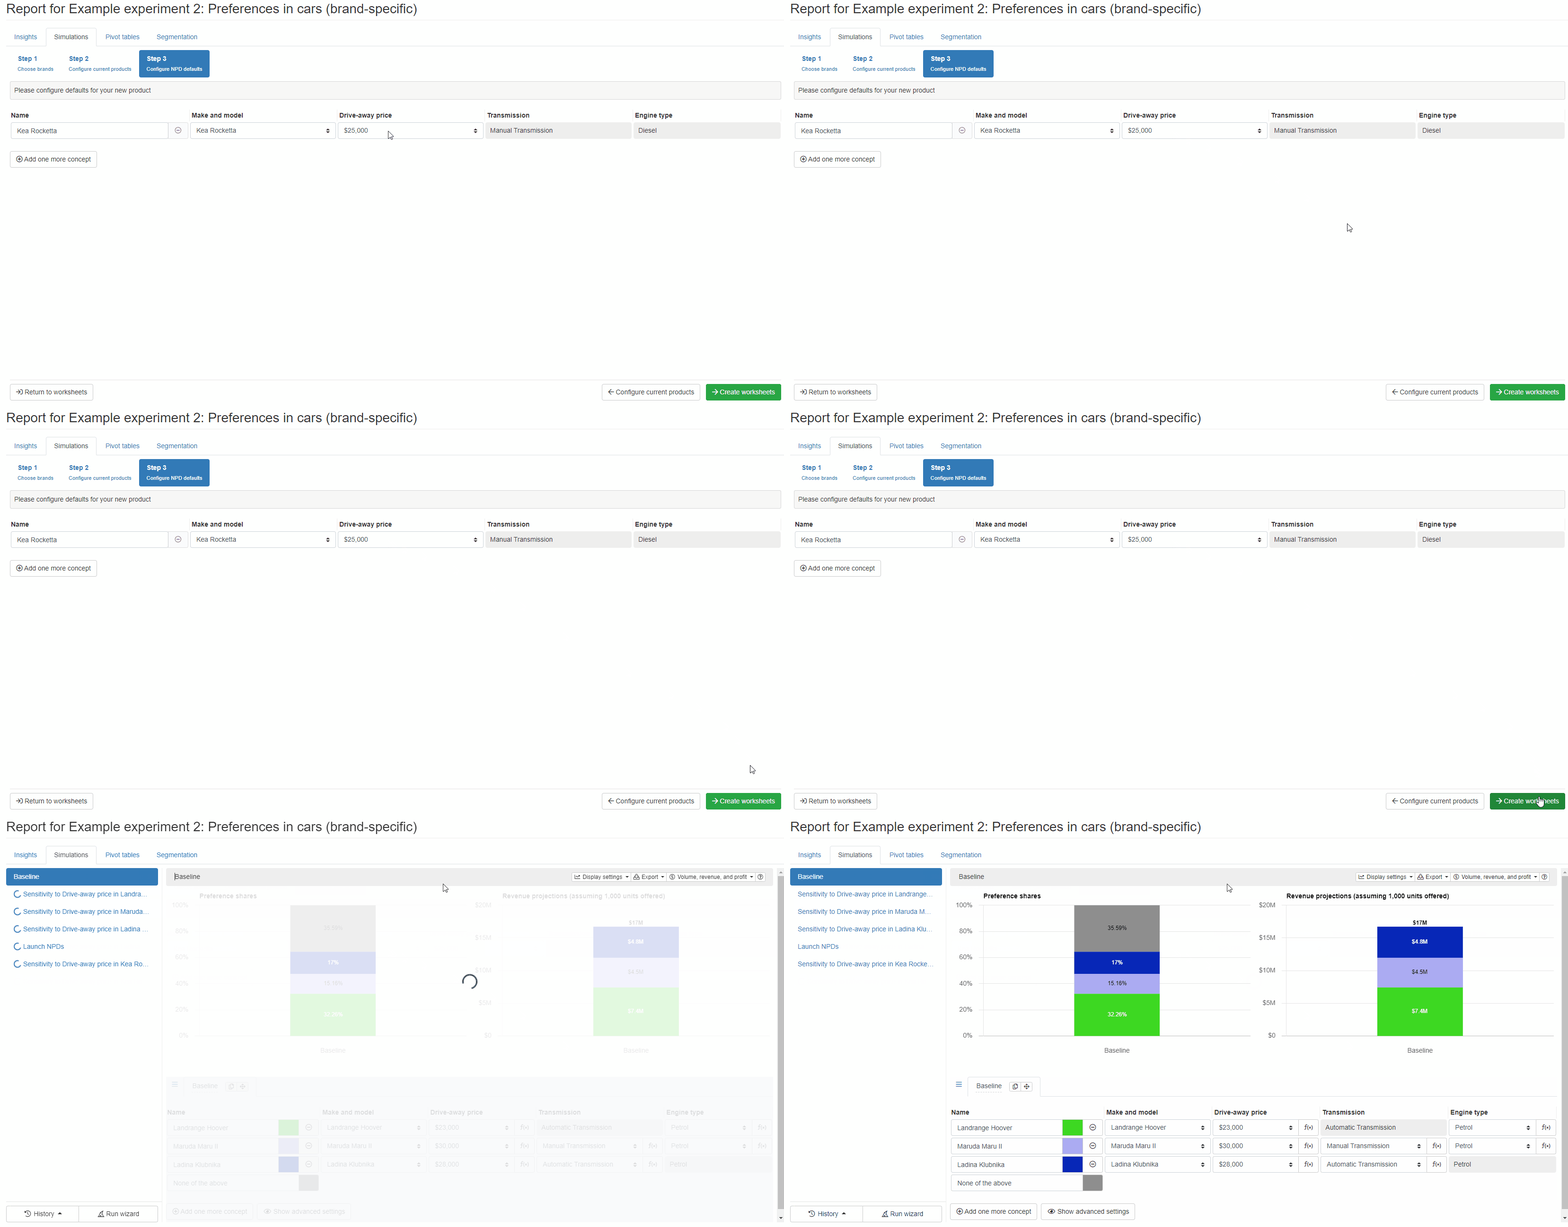
How does the wizard work when you first set up the simulator?
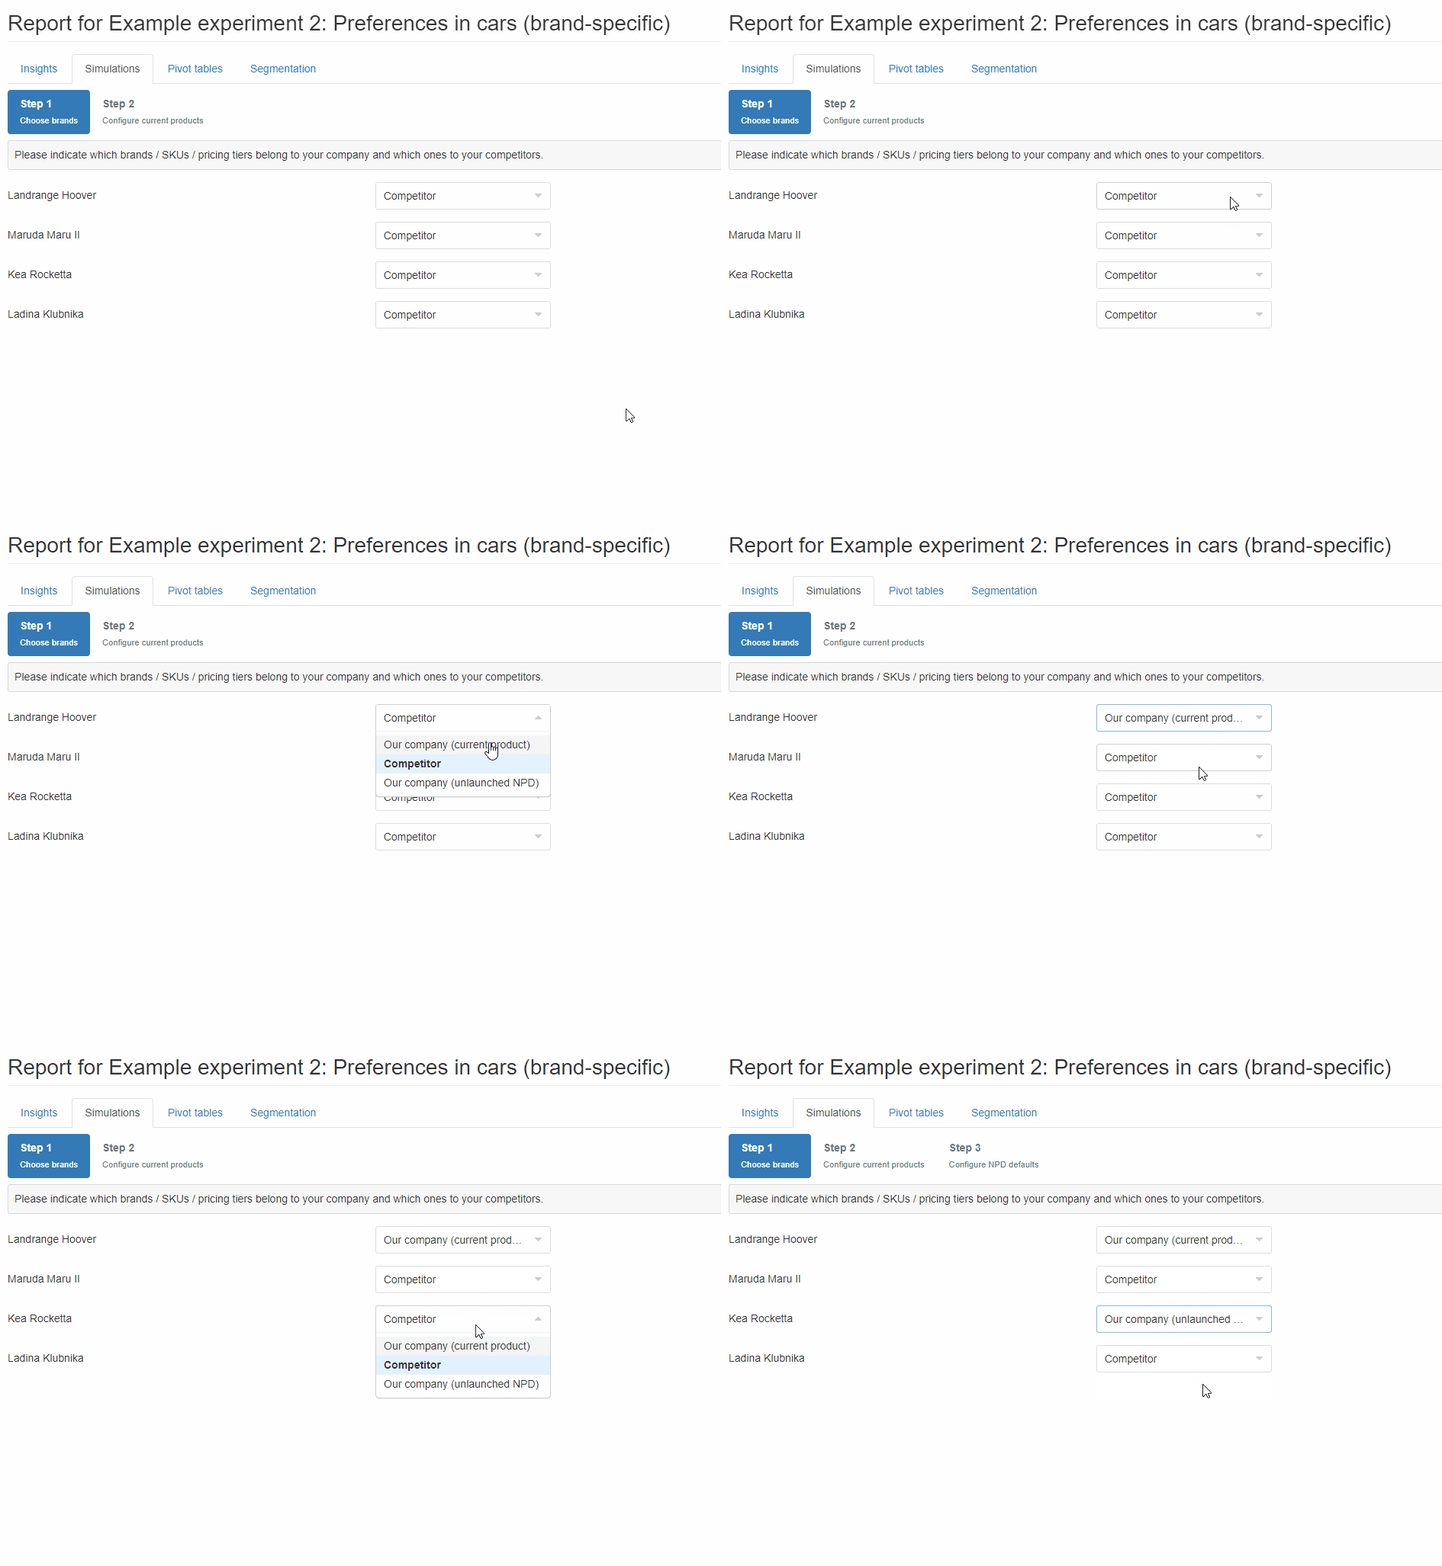
When creating a simulation for your experiment, you will first be prompted with a wizard that will help you to set up the baseline worksheet for your simulation through the following steps:
- Step 1: Indicate which brands / SKUs / pricing tiers belong to your company and which ones to your competitors.
- Step 2: Configure current brands / SKUs / pricing tiers (including both your company’s and competitor products).
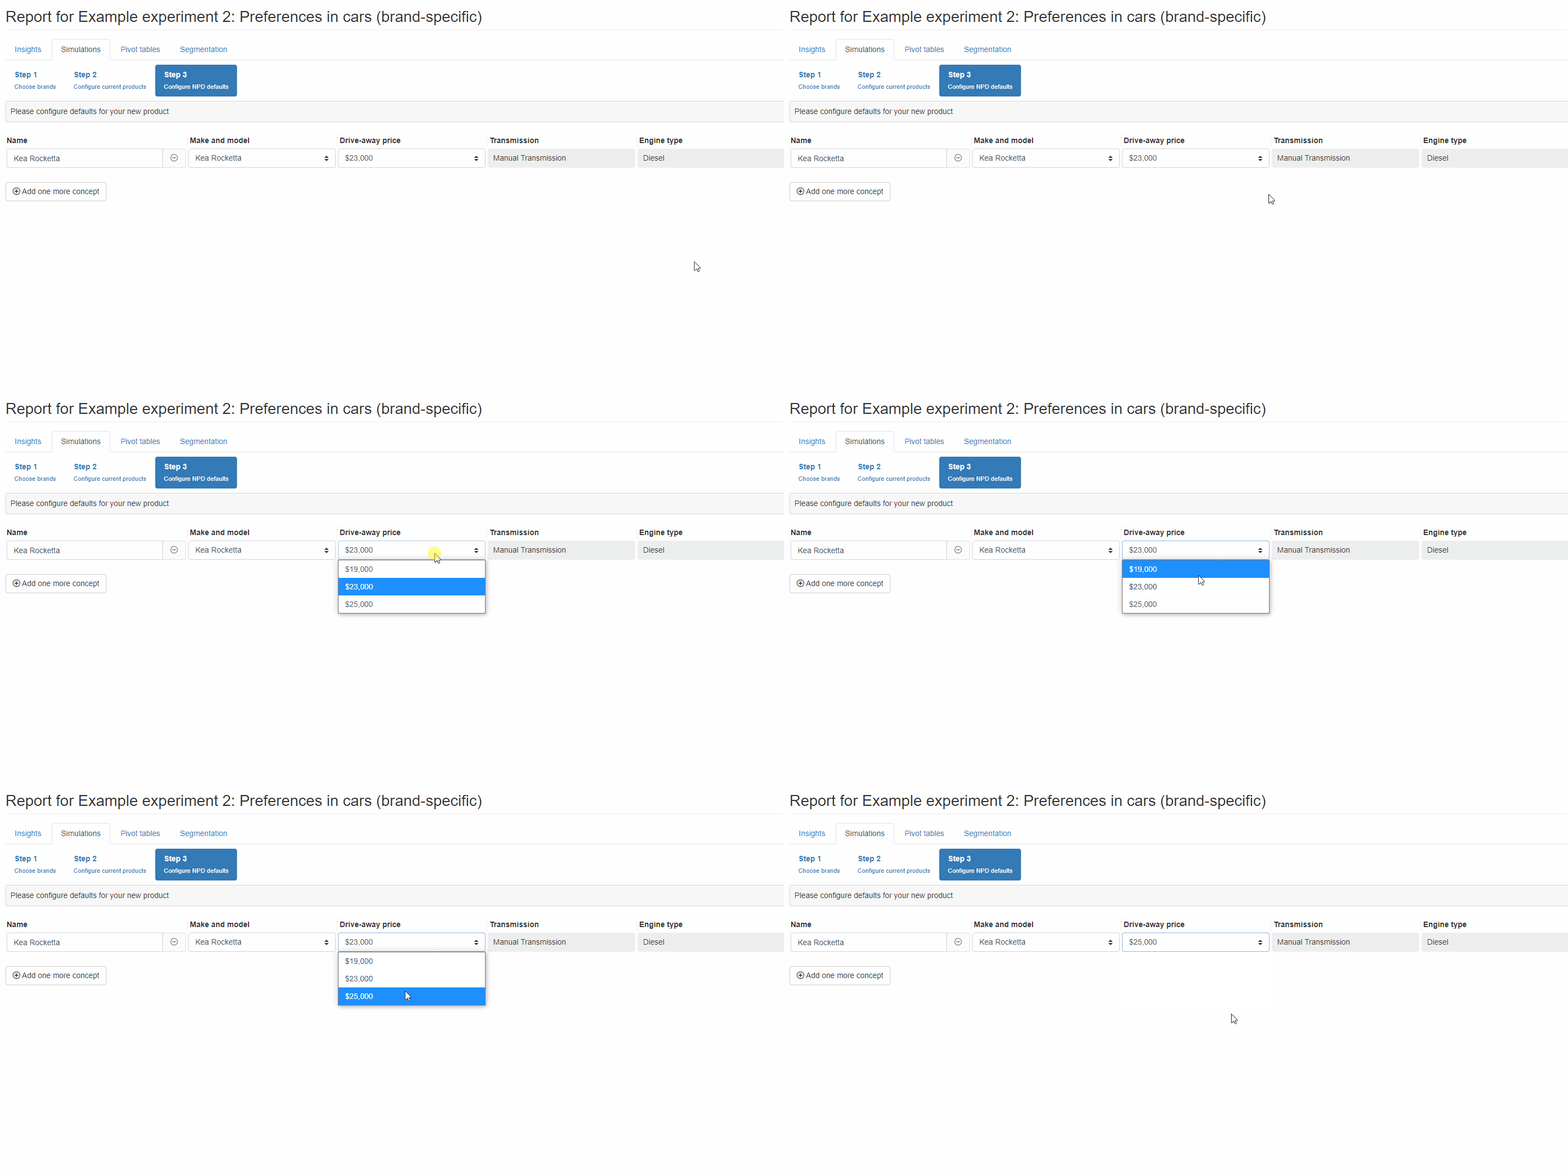
- Step 3: Configure defaults for your new product (Only applicable if there is at least one Unlaunched NPD indicated in Step 1).
- Step 4: Select in the bottom right-hand corner. Your simulator will now be ready to use, initialised with relevant simulations for your SKUs.
FAQs
Are preference shares same as market shares?
No, preference shares are different from market shares for three reasons:
- They are conceptually closer to volume shares (i.e. a more expensive product may have same preference/volume share, but will have higher value/market share).
- Preference share does not take into account shelf availability, mental availability, and factors that are not covered by conjoint attributes.
- Preference share may fail to take into account frequency of purchase or product sizing that differs among products (i.e. difference between preference for a concept and buying specific quantities of products).
Can you simulate preference shares based on MaxDiff studies?
Using the simulator for MaxDiff should be done with caution because the simulator answers the question “What % of time would a particular option be chosen?”. Choice-based questions (i.e. Conjoint or Claims Test) can accurately answer the simulator’s question because they are about choice among several options, whereas MaxDiff asks both “best” and “worst” choices and uses the “worst” choice in calculating utilities as well.
This means that an option that is occasionally named “worst” in a choice set will have a lower predicted preference share in MaxDiff than it would in conjoint (where we do not consider “worst” options), which can cause overestimation of preference shares for the topmost preferred options.
For this reason, we suggest using simulations for choice-based exercises only as these are robust whereas MaxDiff simulations are only indicative.
To see the above features of Conjointly in more detail you can start experimenting with the Conjointly simulator using “Example experiment 2: Preferences in cars (brand-specific)” in your example experiment library.
Would you like to see more example conjoint reports? Log in to explore example reports.