Exporting as an Excel Workbook
Conjointly makes it easy to export different data from your experiments into Excel:
- Specific summary analyses
- Individual partworths for each respondent
- Answers to each question for each respondent
Export of summary analyses
Follow these steps to export the results of your Conjointly experiment to an Excel workbook.
1. Add outputs to export
Select which outputs you would like to add to export by navigating to each output and clicking on the “Add to export” button. Alternatively, click on the “Export analyses” button at the bottom of the page to open the analysis cart with respondent information, conjoint data, and data dumps automatically added.

2. Open analysis export cart
Click on the Export analyses button at the bottom of the screen in the insights tab to open the analysis export cart. Here you will be able to see all the outputs you have added to export.

You can also add respondent information, conjoint data, data dumps, and an interactive simulator through on the “Add more outputs” dropdown menu.

- Data dumps: Includes the worksheets (if available):
- Questions
- Item of questions
- Stimuli in monadic block
- Answers to questions
- Answers to question items
- Crosstab by segment
- Diagnostic questions
- Brands tested
- Crosstab by item scores
- Segment membership
- Covariates
- Interactive simulator: Includes a worksheet to do simulations in Excel.
3. Export as Excel
Once all the desired outputs have been added to the cart, click the “Make Excel file” and Conjointly will compile the download file.
This process can take a few seconds. When the file is ready, click on the “Download it now” button on the sidebar to download the Excel workbook.

Individual partworths for each respondent
To view individual partworths for each respondent, ensure that “Conjoint data” is included in your export cart.
In order to understand the meaning of these coefficients in a Brand-Specific Conjoint, let’s take a look at Example experiment 2 in your experiment list:
- Column ASC: Opt-in is the reverse value of “None of the above” option. A higher opt-in value means that the respondent is less likely to select the “None of the above” option.
- Preferences for brands are highlighted in columns
B2toB4. In this case, preferences for column B1 (Landrange Hoover) are not shown / set to 0 (because it is a dummy variable / point of reference for brands) [Note: In partworths utility form, the first variable is the baseline dummy variable / point of reference for the attribute. Utilities for other variables are based on the first variable. For example, compared to B1 (Landrange Hoover), the first respondent has -5.4 utility with B2 (Maruda Maru II), -5.3 utility with B3 (Kea Rocketta), and -9.9 utility with B4 (Ladina Kubnika). Learn more about dummy variable.] - Similarly, preference for levels are highlighted in subsequent columns. The columns highlighted below (
B1A2L2andB1A2L3) represent the preferences for price of Landrange Hoover, where:B1A2L1= Not shown / 0 (because it is a dummy variable / point of reference for prices)B1A2L2= Preferences for Landrange Hoover price of $23,000B1A2L3= Preferences for Landrange Hoover price of $25,000
To find the utility for “None of the above”, look for the “ASC Opt-in” column:
Answers to each question for each respondent
To download additional question answers for each respondent, make sure that Excel table of respondents is included in the analysis cart when you export.
By default, only the respondents that are included in the analysis (i.e. having the “Included in the analysis” status under the Included in analysis? column in participant list) will be included in the online report and the export. However, when you are exporting the report, you can select the option “Include monadic and unused data” for the item Excel table of responses to generate a respondent data with all entries including the excluded respondents.

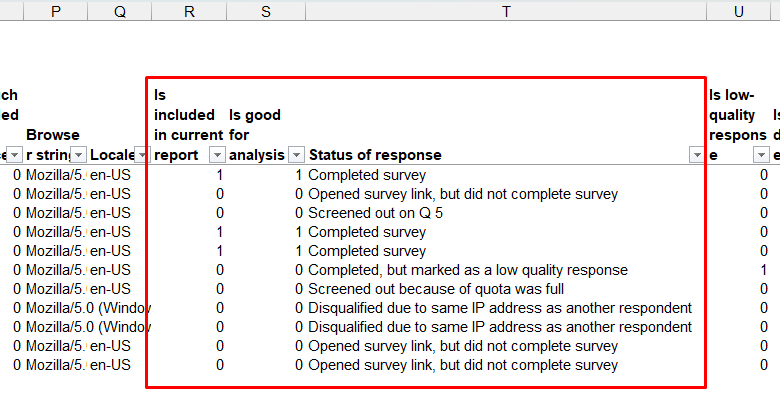
In the exported Excel output, you can find the respondent data in the Respondents worksheet along with their answers to your questions in the survey. You can filter the respondents based on the following columns:
- Is included in current report: Whether this response is included in analysis for the current report, 1 means yes and 0 means no
- Is good for analysis: Whether this response is a valid response that can be included in analysis, 1 means yes and 0 means no. This column might be different from
Is included in current reportwhen there are new responses collected but you have not recalculated the report, thus the additional completes are good for analysis but not yet included in the current report - Status of response: The respondents’ status of the study
Please also take note that respondents with “Completed, but marked as a low quality response” and “Screened out” statuses will have their answers recorded up to the last question they answered before they were excluded from the study. However, respondents with “Opened survey link, but did not complete survey” status will not have their answers recorded as they did not submit their responses and left the survey.

Coding of individual Gabor-Granger results in Excel
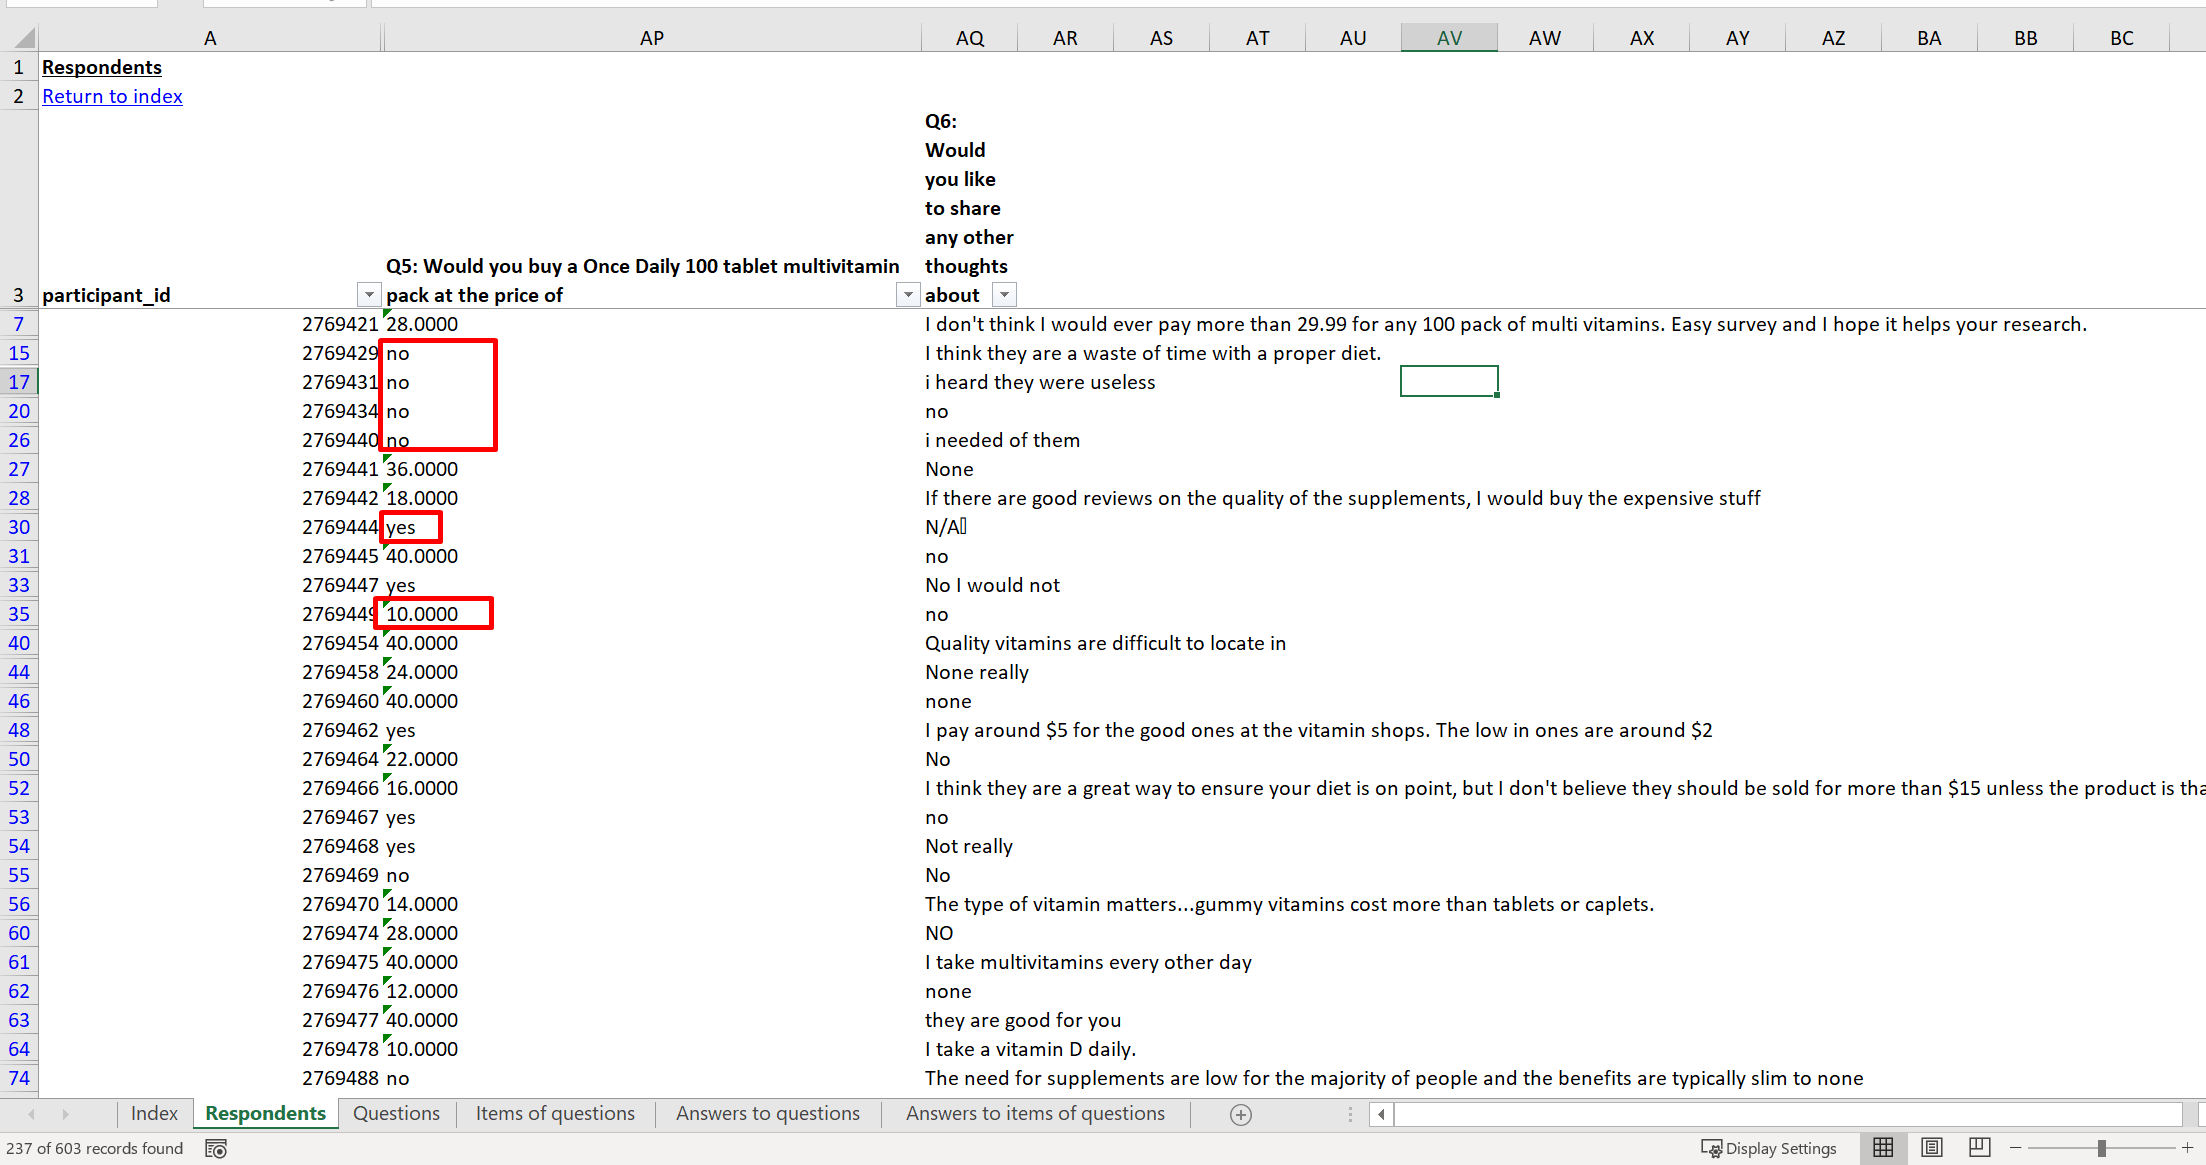
After downloading the Excel export with “Respondent info” included, navigate to the Respondent tab in the worksheet. You can then view individual responses. Please note that:
- The number value indicates the highest price that the respondent is willing to pay for the product.
- If the qualifying question was not enabled and the respondent is not willing to purchase the product at any of the presented prices, the cell will show
yes. - If the qualifying question was enabled and
- The respondent is willing to buy the product (as per the qualuifying question), but not willing to do so at any of the presented prices, the cell will show
yes; - The respondent indicated that they would not be willing to purchase the product at all (in the qualifying question), the cell will show
no.
- The respondent is willing to buy the product (as per the qualuifying question), but not willing to do so at any of the presented prices, the cell will show

Acronyms used in the Excel report
You can find the meaning of the acronyms used in the Excel report below:
Tab: Experimental design
The experimental design is an important core component of all statistical experiments. It defines the choice tasks that respondents will see. You can think of these as the independent (or x) variables in the model, and respondents’ selections will be the dependent (or y) variables.
BLOCK: Design block, or version of the design. The experimental design contains several different versions. Each respondent is randomly assigned to one of these design blocks.QES: Question, choice task number. Each block contains several tasks, usually around 12, each of which contains information on what respondents will see on a page.ALT: Alternative, within a choice task (or question) there will be several choices shown to respondents, usually around 5. This variable indicates the number of choices in a question.A1: Attribute 1, contains the level of attribute 1 that will be displayed for a particular alternative. There will be as many such variables,A2,A3, … as there are attributes in the experiment.
Tab: Design matrix
BLOCK: Design block, or version of the design. The experimental design contains several different versions. Each respondent is randomly assigned to one of these design blocks.QES: Question, choice task number. Each block contains several tasks, usually around 12, each of which contains information on what respondents will see on a page.ALT: Alternative, within a choice task (or question), there will be several choices shown to respondents, usually around 5. This variable indicates the number of choices in a question.ASC: Alternative specific constant, a value between1and0, where1indicates the row is an alternative (a choice in the task) and0if the row corresponds to the “None” option.A1L2: Attribute 1 Level 2, if the value is1, it means the second level of attribute 1 was shown. If it is0, it means it wasn’t shown. If none of the levels of an attribute has a value of 1, it means that level 1 of the attribute was shown (this would beA1L1). There will be as many such variables,A1L2,A1L3,A2L2… as attributes multiplied by levels minus the number of attributes (corresponding at the first level not shown).
Note: A1L1, A2L1, A3L1, and all first levels of each attribute aren’t added as columns, because it would cause multicollinearity with the combination of the other levels.
Tab: Raw responses
ID: participant_id who answered that specific row.BLOCK: Design block, or version of the design. The experimental design contains several different versions. Each respondent is randomly assigned to one of these design blocks.q1: Question, choice task number 1. This corresponds to the value1in the columnQESof the Design matrix. There will be as many such variables,q2,q3… as there are choice tasks in the experiment.
Tab: Model matrix
ID: participant_id who answered that specific row.BLOCK: Design block, or version of the design. The experimental design contains several different versions. Each respondent is randomly assigned one of these design blocks.QES: Question, choice task number. Each block contains several tasks, usually around 12, each of which contains information on what respondents will see on a page.ALT: Alternative, within a choice task (or question), there will be several choices shown to respondents, usually around 5. This variable indicates the number of choices in a question.RES: Response, this is the respondent’s selection, in this particular question, 0 indicates that the alternative was NOT selected, and 1 indicates that it was selected.ASC: Alternative Specific Constant, a value between1and0, where1indicates the row is an alternative (a choice in the task) and 0 if the row corresponds to the “None” option.A1L2: Attribute 1 Level 2, if the value is 1, it means the second level of attribute 1 was shown. If it is0, it means it wasn’t shown. If none of the levels of an attribute has a value of1, it means that level 1 of the attribute was shown (this would beA1L1). There will be as many such variables,A1L2,A1L3,A2L2… as attributes multiplied by levels minus the number of attributes (corresponding at the first level not shown).STR: Unique index for the task.
Note: A1L1, A2L1, A3L1, and all first levels of each attribute aren’t added as columns, because it would cause multicollinearity with the combination of the other levels.
Conjointly Excel Plugin

To improve your Excel charting experience, the Conjointly Excel Add-in is now available online. The add-in contains multiple functions that help with charting Conjointly outputs.
Some of these functions include:
- The ability to automatically recolour charts from data cells, for quick and easy chart-making
- A function that enables quick calculation of the price elasticity of demand between two price points
- A button that transforms conditional formatting to static formatting with ease, allowing you to combine multiple forms of conditional formatting.


