Gabor-Granger Pricing Method
The Gabor-Granger pricing method determines the price elasticity of products and services. Developed by two economists, André Gabor and Clive Granger, it has been used since the 1960s. It is particularly useful when:
- You want to get a directionally correct estimate for willingness to pay for the product.
- You want to find revenue-optimising price points.
- All the other components (or attributes) of the product or service are fixed and cannot be changed.
- You only want to look at your brand or SKU without considering competition.
Using Gabor-Granger to measure customer value of online book streaming.
The aim is to find the maximum price each respondent is willing to pay for a product.
Gabor-Granger surveys can be automatically translated to more than 30 languages.
Bring your own respondents or buy quality-assured panel respondents from us.
Main outputs of Gabor Granger
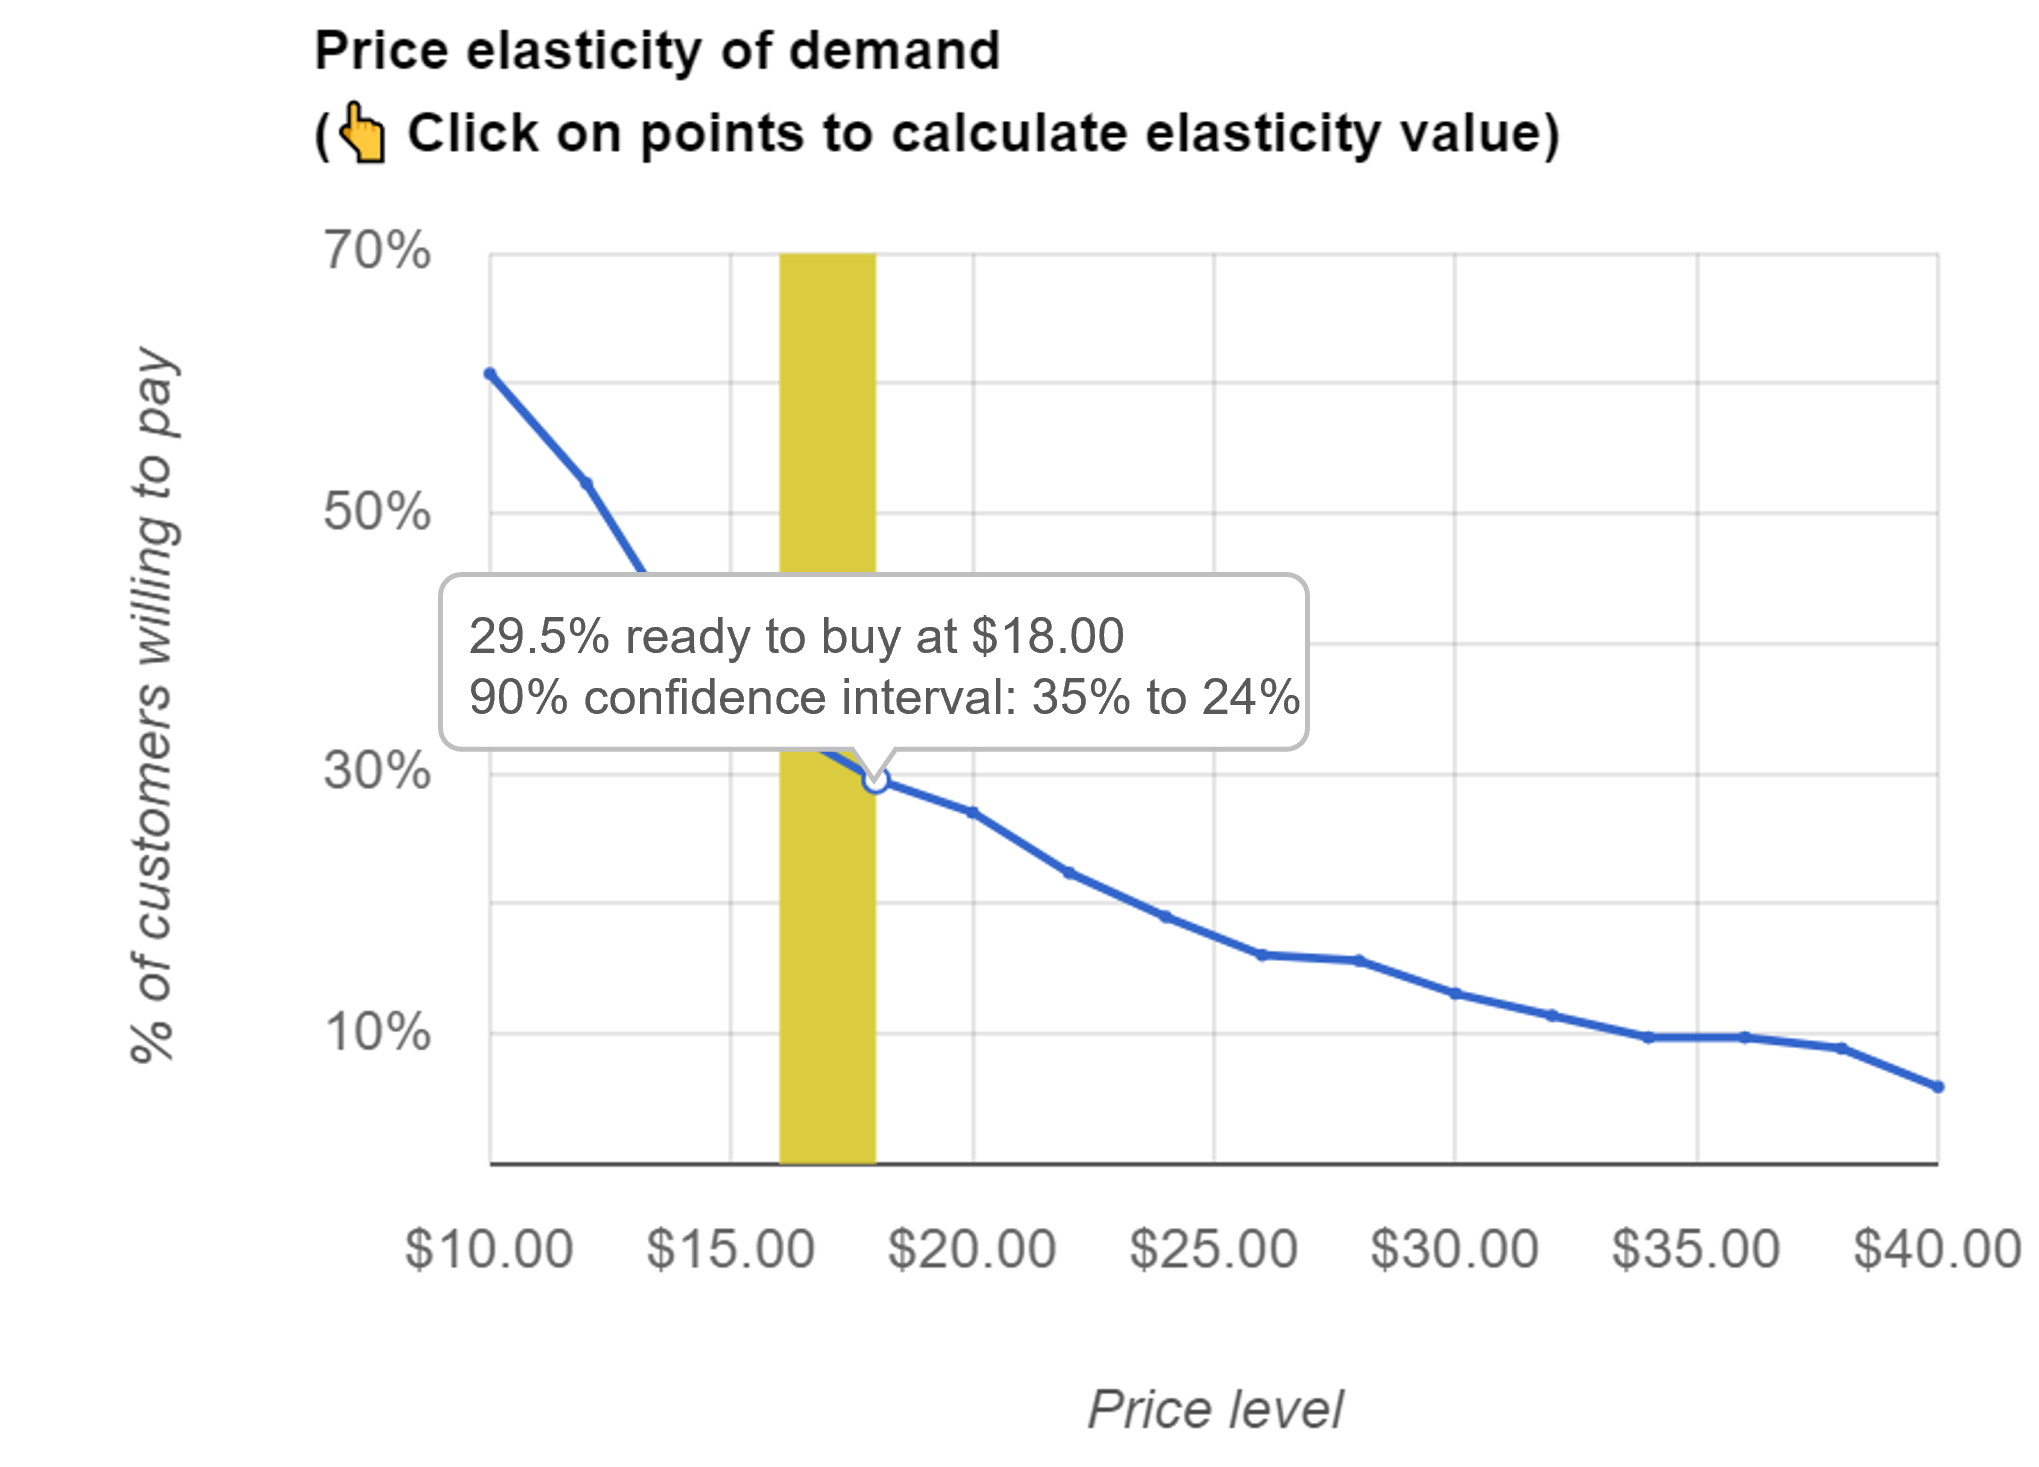
Price elasticity chart
The price elasticity of demand curve shows customers' willingness to pay for your product at different price points. The steeper the demand curve, the more price-sensitive customers are in relation to your product.
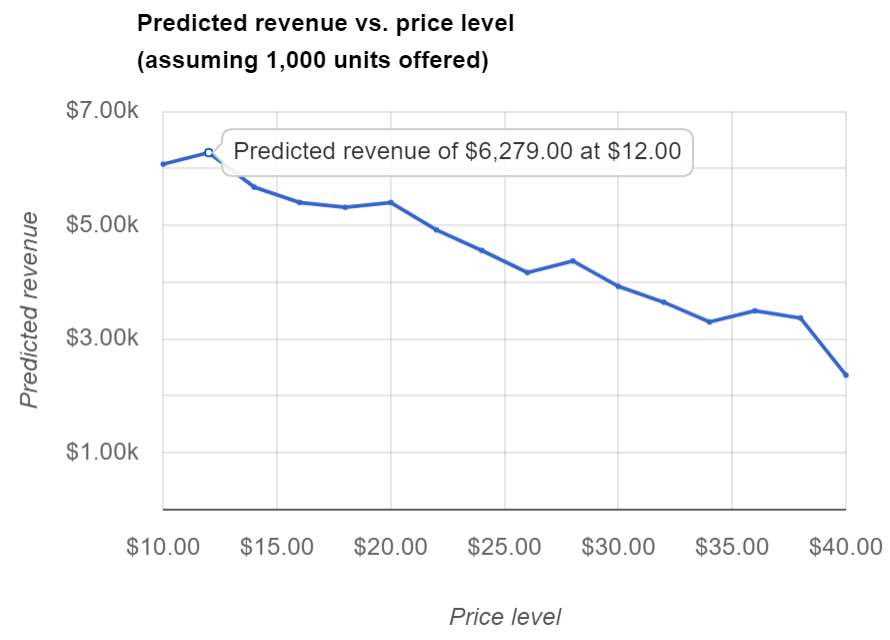
Revenue vs. price chart
The “revenue vs. price” curve helps identify revenue-maximising price points.
For example, this chart below suggests that the revenue-maximising price is around $7.99.
Flow of Gabor-Granger questions
Each respondent is given a series of almost identical questions such as “Would you buy product X at price Y?”. In each of the several questions, the price shown to a respondent is different: it is adapted based on the respondent's previous answer with the aim to find the maximum price each respondent is willing to pay for a product.
In this example, we have price points from $50 to $170 (incremented by $10):
- Respondents are randomly assigned to one price.
- If they are willing to pay that price, they are offered a higher (randomly chosen) price.
- If they are not willing to pay that price, they are offered a lower (randomly chosen) price.
- The algorithm repeats until we find the highest price each respondent is willing to pay.
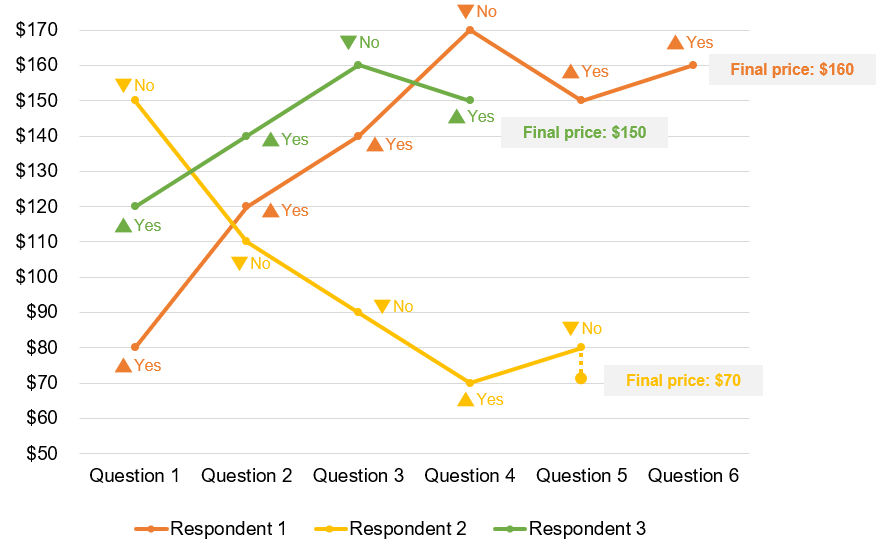
How it works
You need to specify several price levels (ideally, between 8 and 15 price levels, for example: $10, $20, $30, $40, $50, $60, $70, $80, $90. You will also need to provide a description of your product (e.g. a packshot for a consumer good or a list of features for a software plan).
Technically speaking, Gabor-Granger is a type of a randomised sequential monadic test where respondents are sequentially given one option at a time in which they will make a decision upon. When you need to examine product attributes other than price (e.g., design, quality, power) or you also need to look at competitive brands, it would be more appropriate to use conjoint analysis, where price and brand are only two of the attributes among many. Conjoint studies can also provide more precise estimates for total willingness to pay and are less prone to understating the acceptable price by research participants.
There are two biases in the Gabor-Granger methodology, which mostly cancel each other out:
- Understatement of willingness to pay: Where a price is shown explicitly, respondents can reckon that the purpose of the study is to set a price. They may be tempted to understate their willingness to pay to “game” the company into offering lower prices.
- Overstatement of purchase intention: While respondents may state a willingness to purchase a product in a survey, real-life purchase decisions will often be swayed by many other factors and will result in a lower level of buying than reported in the test.
On Conjointly, you can add as many Gabor-Granger exercises in a single experiment as you need (to test different products). Gabor-Granger can be used as a separate experiment or an additional question added to conjoint, Van Westendorp (which can supplement the Gabor-Granger with a different take on pricing), or another experiment type. In some cases, a Gabor-Granger exercise is added after conjoint to measure price sensitivity of extras and paid add-ons to the main product, which composition is optimised through conjoint analysis.
Application in selection of subscription model and pricing
Subscription-based companies often face the problem of choosing not only the price point (i.e. the amount per unit of service), but also the business model for their products (i.e. what unit should they charge per?). For example, a video streaming business can charge in a couple of different ways:
- Fixed amount per month
- Price per video played
This is a complex decision that involves consideration of recurrence and churn, expected amounts of downloads, cost per download, and many other factors. Gabor-Granger can be used to assess initial adoption rates if one or the other model is offered.
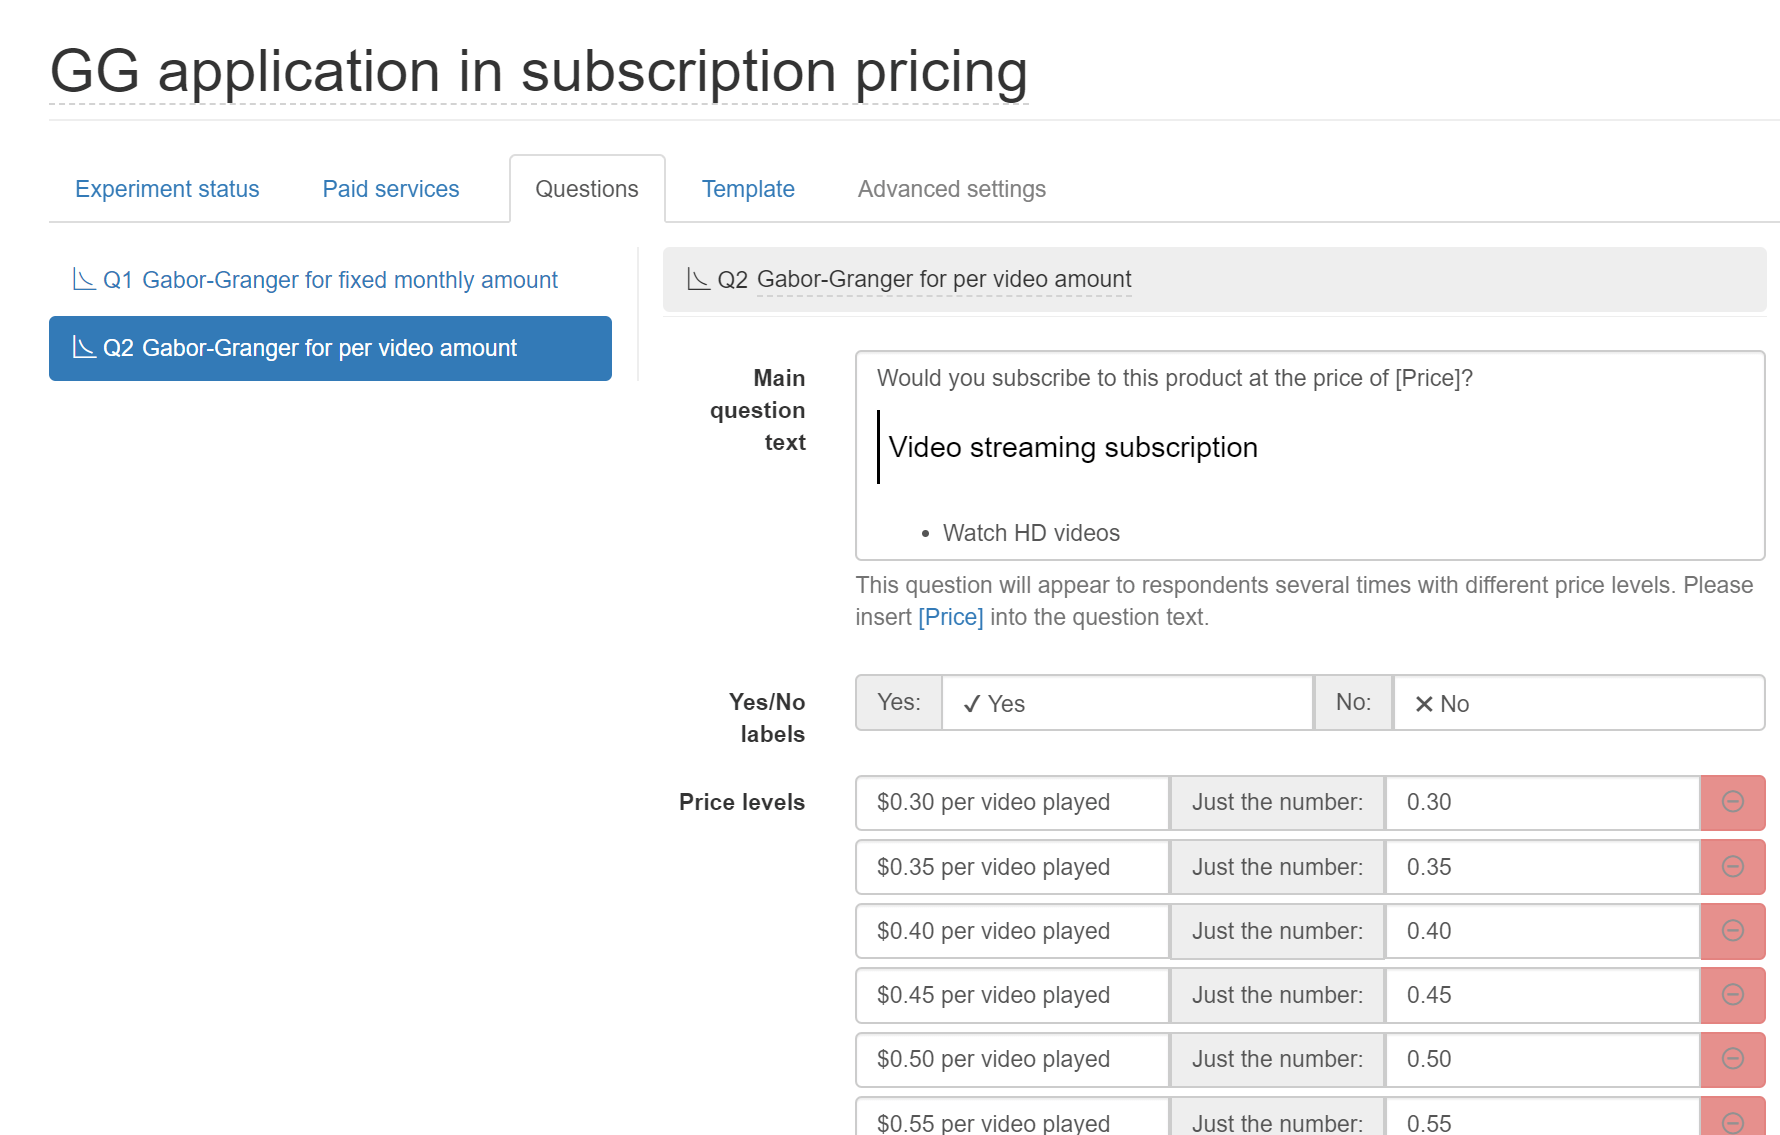
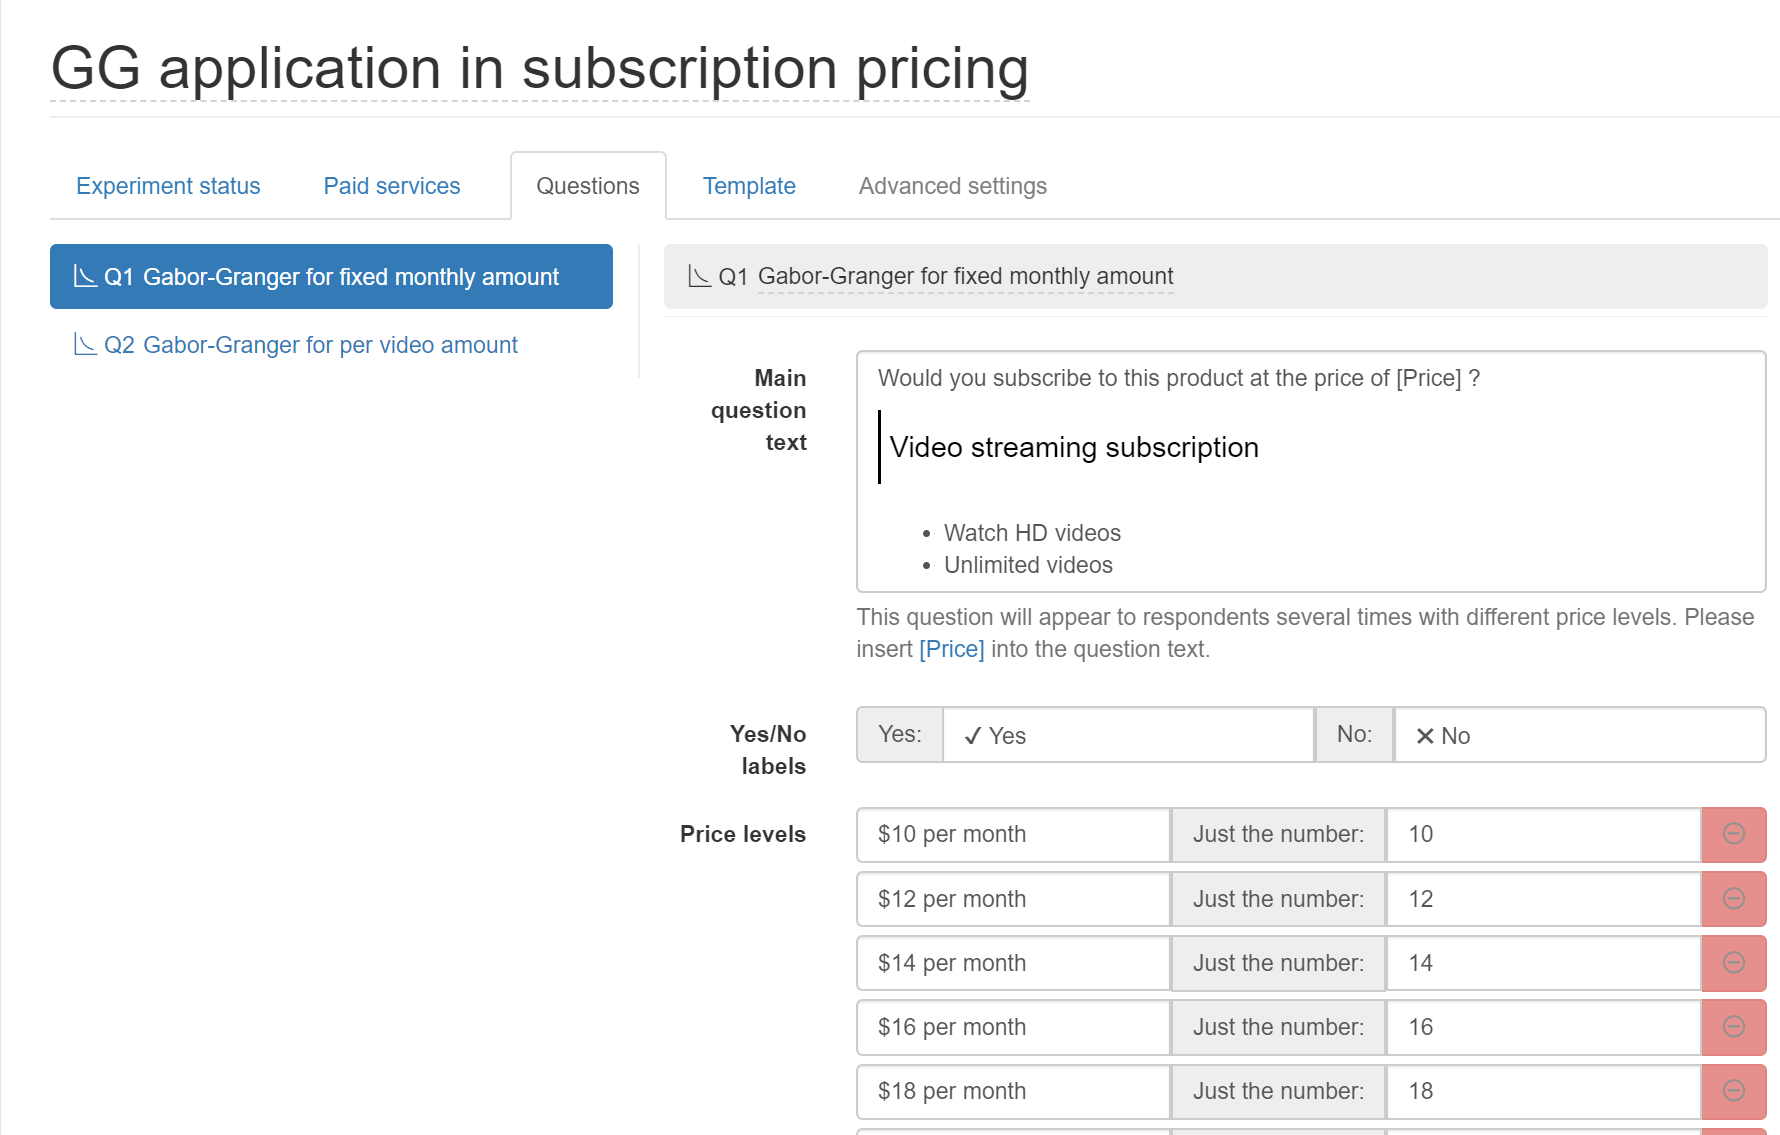
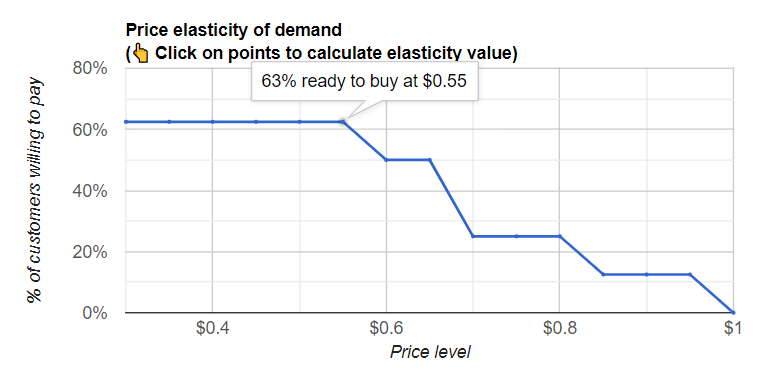
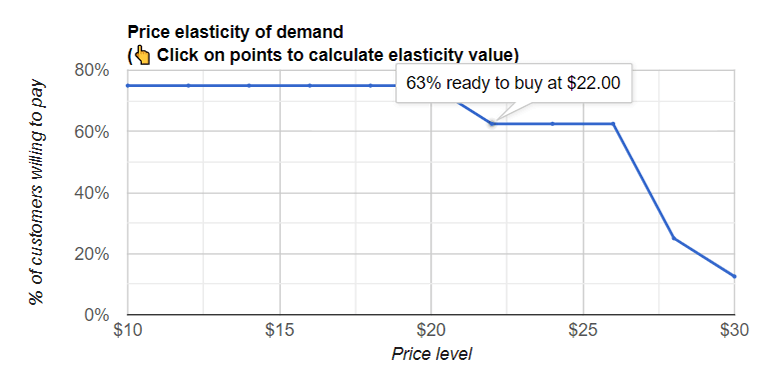
In this instance, one can include two Gabor-Granger questions for each of the fixed amount per month and price per video played. From these two outputs, one can then find the optimal pricing plan / price to charge. You can download the Excel model and see an example of pricing model selection, using various assumptions.
Choosing an optimal discount amount
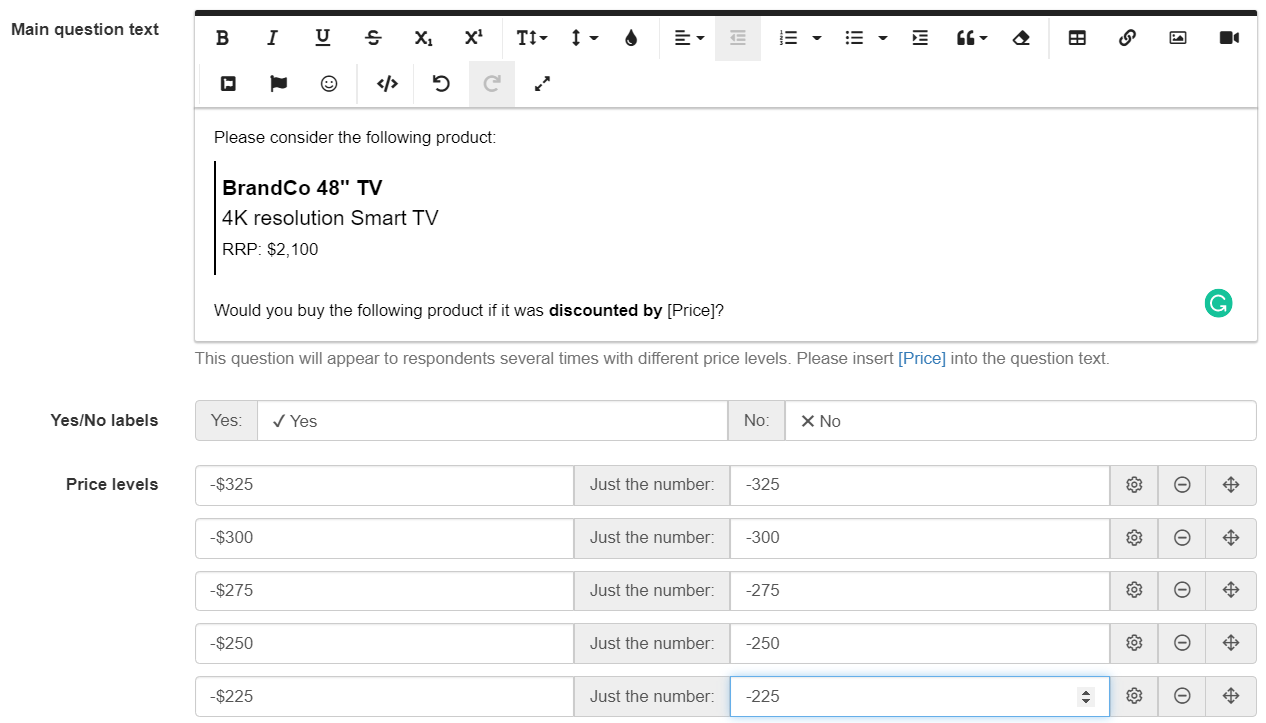
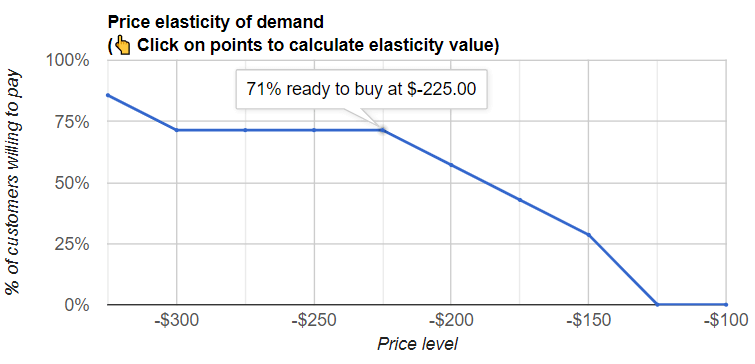
Gabor-Granger can also be used to understand consumers' sensitivity to discounts. You can set this up by entering the value in negative amount (as shown below). This will reverse the order of the bargaining exercise such that if the respondent is willing to buy at $250 discount, the next question will be at a lower price (say $150), as opposed to the default bargaining exercise logic. The Gabor-Granger bargaining exercise will only be shown to respondents who answer "Yes" to the qualifying question of whether they would purchase the product or not.
The screenshot below shows a steep drop in number of consumers willing to buy a product when discount is lower than $225. The main output for this exercise would be the number of consumers willing to buy, rather than the revenue maximising curve.
Complete solution for pricing research
Fully-functional online survey tool with various question types, logic, randomisation, and reporting for unlimited number of responses and surveys.
Efficiently test up to 300 product claims on customer appeal, fit with brand, and diagnostic questions of your choice.
Efficiently test product concepts to identify the best one for your business
Identify winning product variants from up to 300 different ideas (e.g., designs, materials, bundle options) on customer appeal, fit with brand, and diagnostic questions of your choice.
Efficiently test product descriptions to identify the best one for your product
Efficiently screen product ideas to identify the best one for your business
Feature and claim selection and measuring willingness to pay for features for a single product.
MaxDiff (aka Maximum Difference Scaling or Best–Worst Scaling) is a statistical technique that creates a robust ranking of different items, such as product features.
Efficiently test packages to identify the best one for your product
Pricing, feature and claim selection in markets where product characteristics vary across brands, SKUs, or price tiers.
Perform focussed comparisons between two items to determine which performs better.
Ask respondents to evaluate product concepts and digital assets one-by-one to get a read of their preferences and perceptions with various question types.
Efficiently evaluate potential business names to identify the best one to represent your brand
Efficiently test potential image ads to identify the best one for your business
Efficiently test ad copy to identify the best one for your brand
Efficiently test potential brand names to identify the best one to represent your business
Efficiently test print ads to identify the best one for your campaign
Efficiently test potential product names to identify the best one to reflect your brand
Test the effectiveness of your videos in an online environment
Efficiently test potential logos to identify the best one for your brand
Efficiently test out-of-home ads to identify the best one for your campaign
Efficiently test potential domain names to identify the perfect new home for your brand
Efficiently test potential business card designs to identify the best one for your business
Efficiently test potential NFT artwork to identify the best one for the marketplace
Efficiently test product concepts with Market Test
Efficiently test graphic designs with Market Test
Efficiently test graphic designs to identify the best one for your brand
Determine price elasticity for a single product and identify revenue-maximising price level.
Efficiently test potential brand names with Market Test
Efficiently test potential domain names with Market Test
The Price Sensitivity Meter helps determine psychologically acceptable range of prices for a single product and approximately estimate price elasticity.
Conduct automated TURF analysis on results of any Conjointly experiment (or an outside dataset) using this user-friendly TURF analysis tool.
Efficiently test potential logos with Market Test
Efficiently test ad copy with Market Test
Efficiently evaluate potential business names with Market Test
Efficiently test potential image ads with Market Test
Test pricing of new and existing consumer goods in a competitive context using elasticity charts, revenue, and profitability projections.
Efficiently test potential business card designs with Market Test
Ensure product-market fit and maximise your user acquisition and expansion, by differentiating software features according to your users' needs.
Efficiently test potential product names with Market Test
Efficiently test print ads with Market Test
Efficiently test product descriptions with Market Test
Efficiently screen product ideas with Market Test
Efficiently test out-of-home ads with Market Test
Efficiently test packages with Market Test
Efficiently test potential NFT artwork with Market Test