Reviewing List of Survey Participants
The Participants page allows you to:
- View respondent data recorded by Conjointly, including location, device, interview length, status, and more.
- Exclude or include completed respondents from the analysis.
- Access the drop-off report.
- Add pivot tables to delve deeper into respondent data.
- Upload external data.
- Export respondent data.
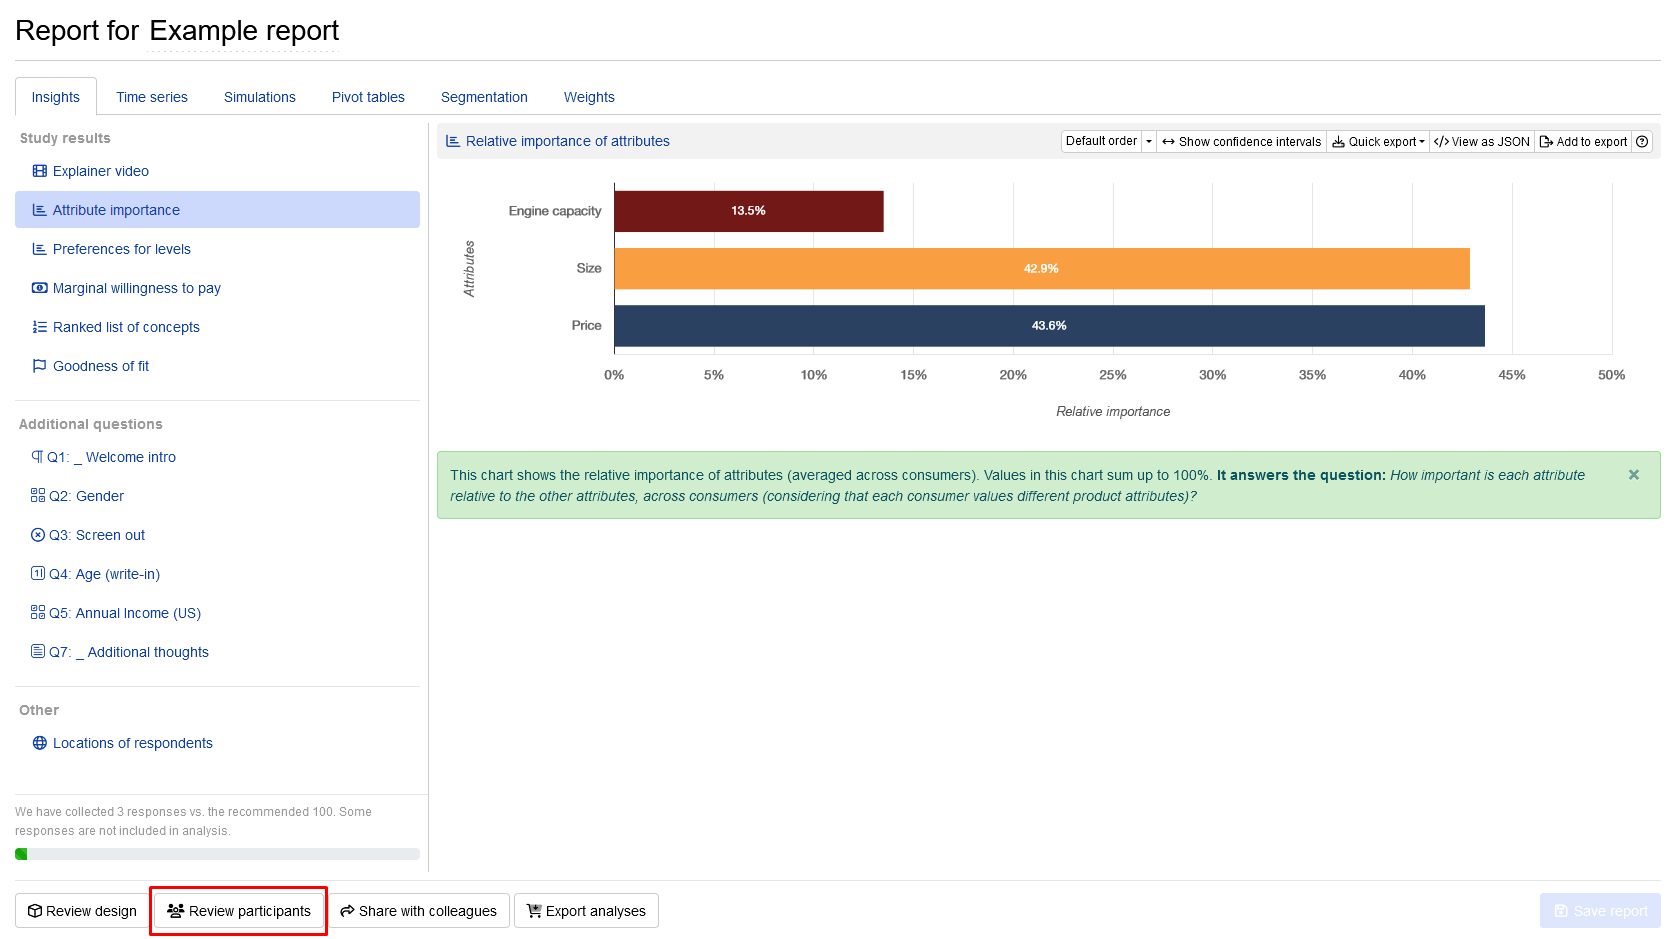
To access this page, click on the button on the bottom-left of the report page.

Respondent status categories
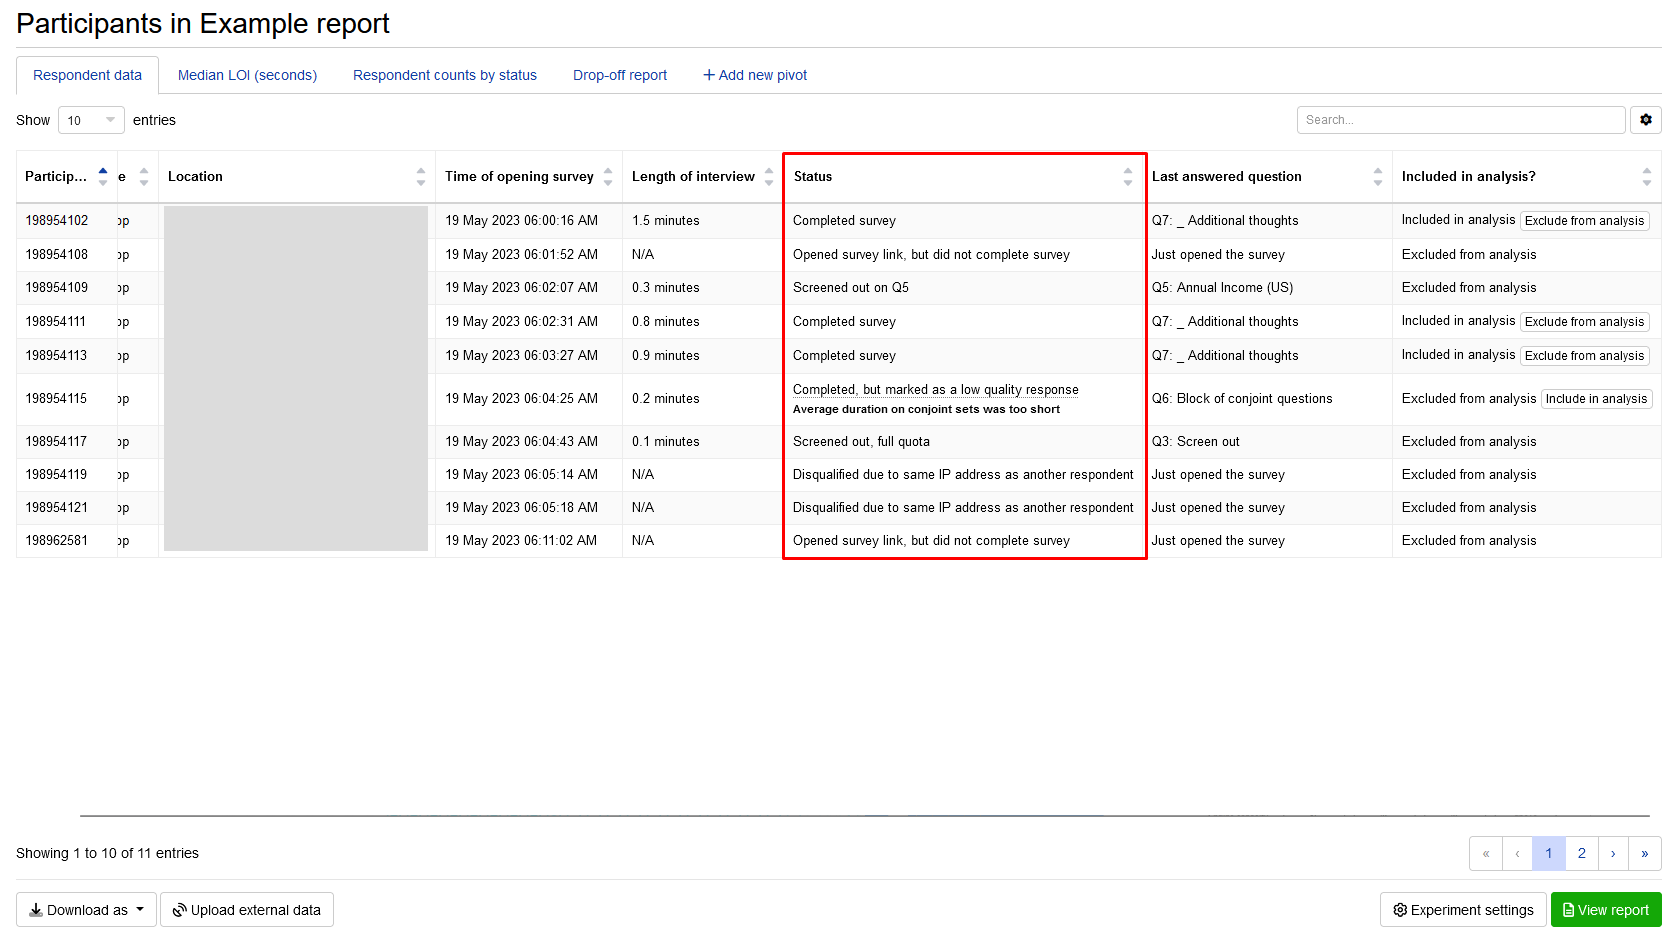
The Status column on the Respondent data tab shows whether the respondent completed the survey and provide reasons if they did not.

Here are a few possible statuses:
Completed survey
Respondents completed the survey, and their responses will be included in the online report.Opened survey link, but did not complete survey
Respondents who left the survey halfway through and did not complete the survey, e.g. they closed the browser tab with the survey. Their partially completed responses are not saved and recorded, and they will have to redo the survey if they re-enter the survey.Disqualified due to same IP address as another respondent / Disqualified due to same cookie as another respondent
Respondents had the same IP address or the same browser cookie as a previous respondent and were disqualified from entering the survey. These statuses will only appear if you have enabled the relevant response quality management settings in your experiment.Completed, but marked as a low quality response
These respondents were identified as providing low-quality responses, such as not going through all the options provided or clicking through the survey in a short amount of time.Screened out
Respondents were screened out because they did not qualify for the criteria based on the screening logic in the experiment or if the quota for certain criteria was full. You can also check on the Last answered question column to see which question screened out the respondents.
Excluding or including certain respondents from the report
You can choose to manually exclude respondents from the report by clicking on the button under the Included in analysis? column of the Respondent data tab. Similarly, you can add specific completed respondents to the analysis by clicking the button.

You can also mark respondents to be included or excluded from the analysis by uploading a special external variable called CONJOINTLY_ACTION.
Accessing the drop-off report
You can find the drop-off report (also called fall-off statistics) by clicking on the Drop-off report tab on the Participants page. It is a pivot table that further breaks down respondent statuses, based on the reasons for completed respondents being marked as low-quality or reasons for being marked as incomplete survey.

Here are a few possible sub-statuses that respondents will be categorised into:
Average duration on conjoint sets was too short
The average time these participants spent on the conjoint sets was too short. Participants might not have thoroughly considered the options or have made thoughtful choices.Duration on some conjoint sets was too short
Participants spent very little time on certain conjoint choice sets, potentially showing a lack of careful consideration.Respondent moved their mouse too little
Participants did not engage much with the survey interface or did not actively interact with their mouse. It indicates a lack of attention during the study.Respondent did not look through all alternatives
Participants did not thoroughly review or examine all the available alternatives in the study. If they did not look through all the options, their choices may not be fully informed or reflective of their preferences.Respondent answered suspiciously to Q19
The participant’s answer to question 19 raised suspicions or appeared unusual in some way. The response may have contained questionable content.Respondent provided duplicate answers to an open-ended question
Participants provided the same answer or content in a previous open-ended question. Duplicate answers in open-ended questions could suggest a lack of attention or effort on the part of the respondent that is typically not desired.
Using pivot tables to view the summary of respondent data
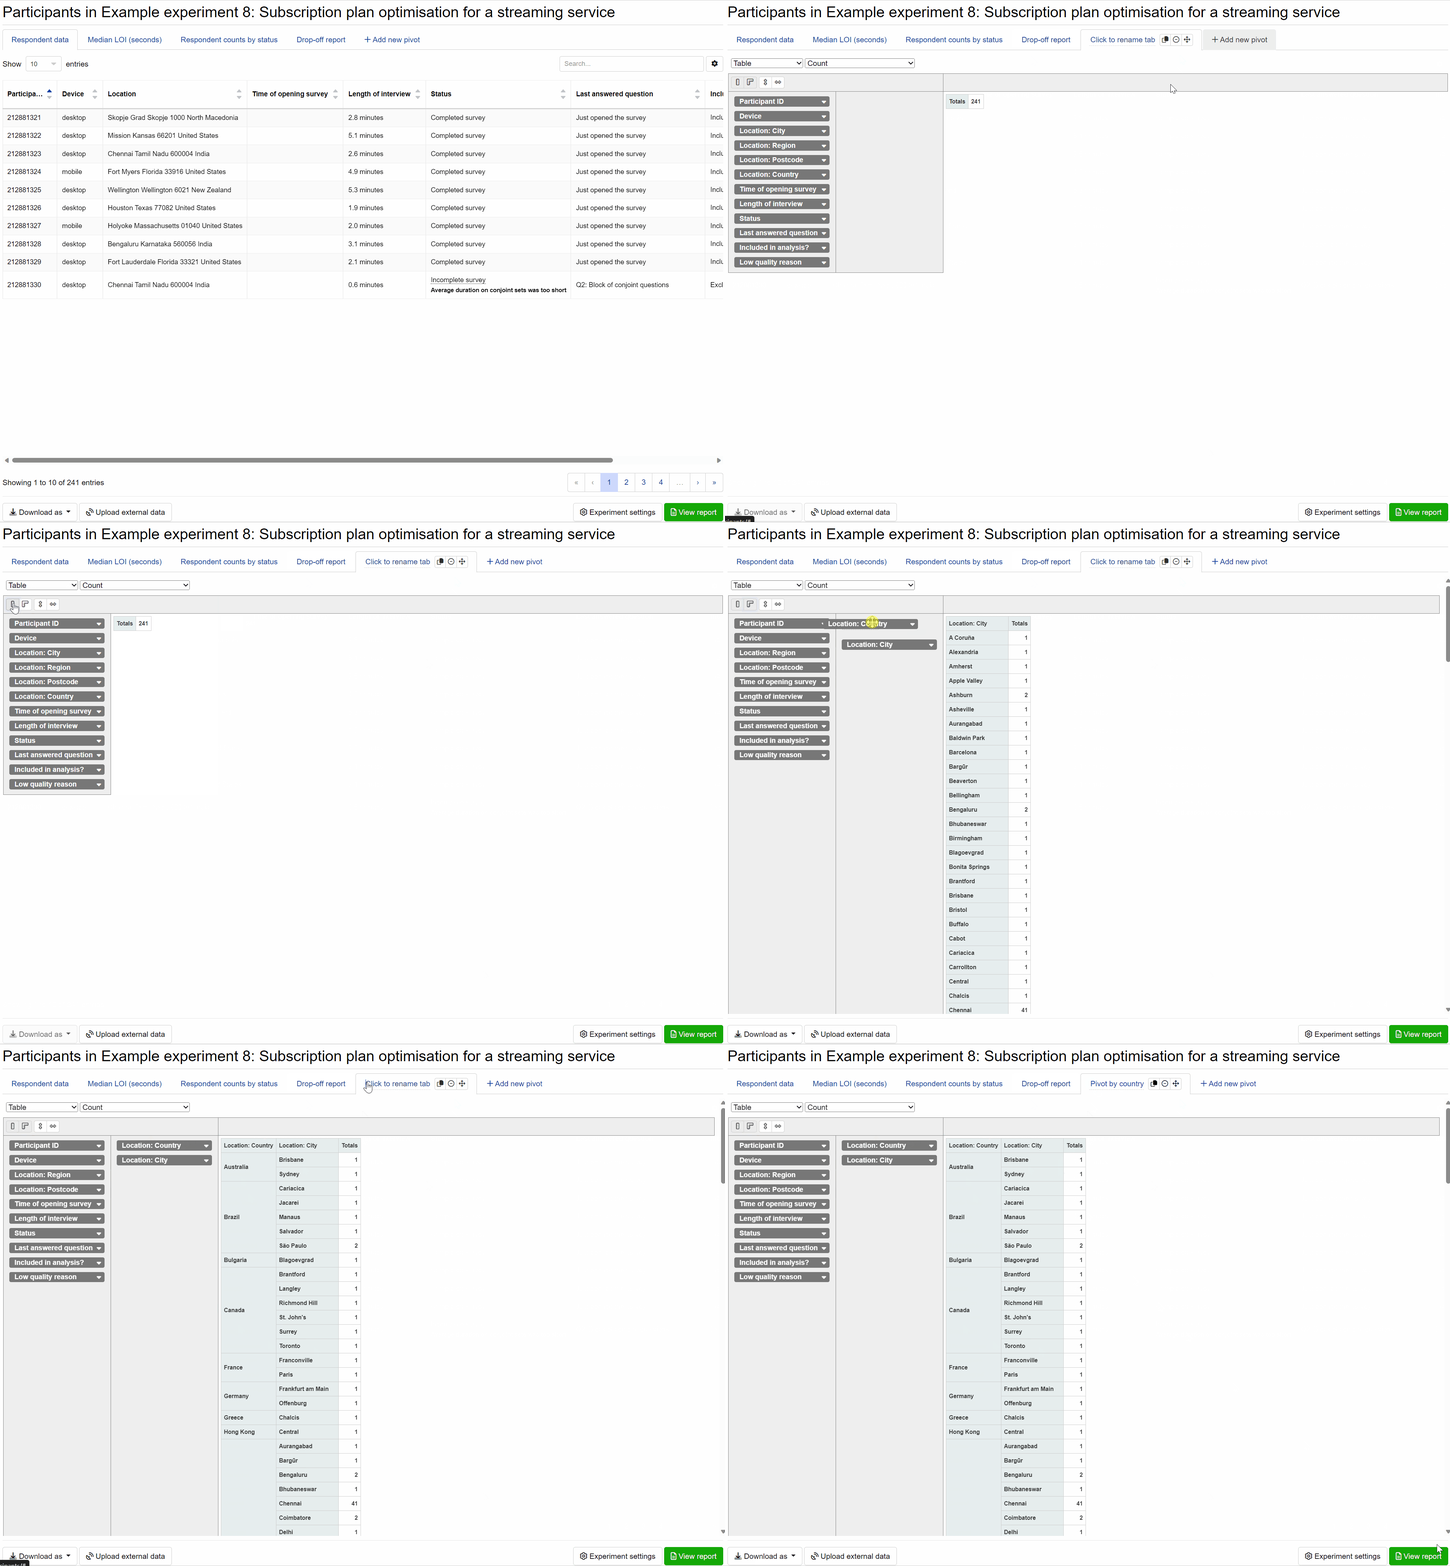
Pivot tables allow you to easily view summary data about your respondents. To create a new pivot table:
- Click on the Add new pivot tab.
- Toggle the two ruler icons (
 ) to display both/either the column and row of the pivot table.
 - Drag attributes into the right-hand column to view the count of each attribute (including multiple attributes allows you to view multiple splits).

Uploading external data
You can upload external data of your respondents, such as their demographic profiles, in a .csv or .txt file to set up segmentation in your report.
Exporting respondent data
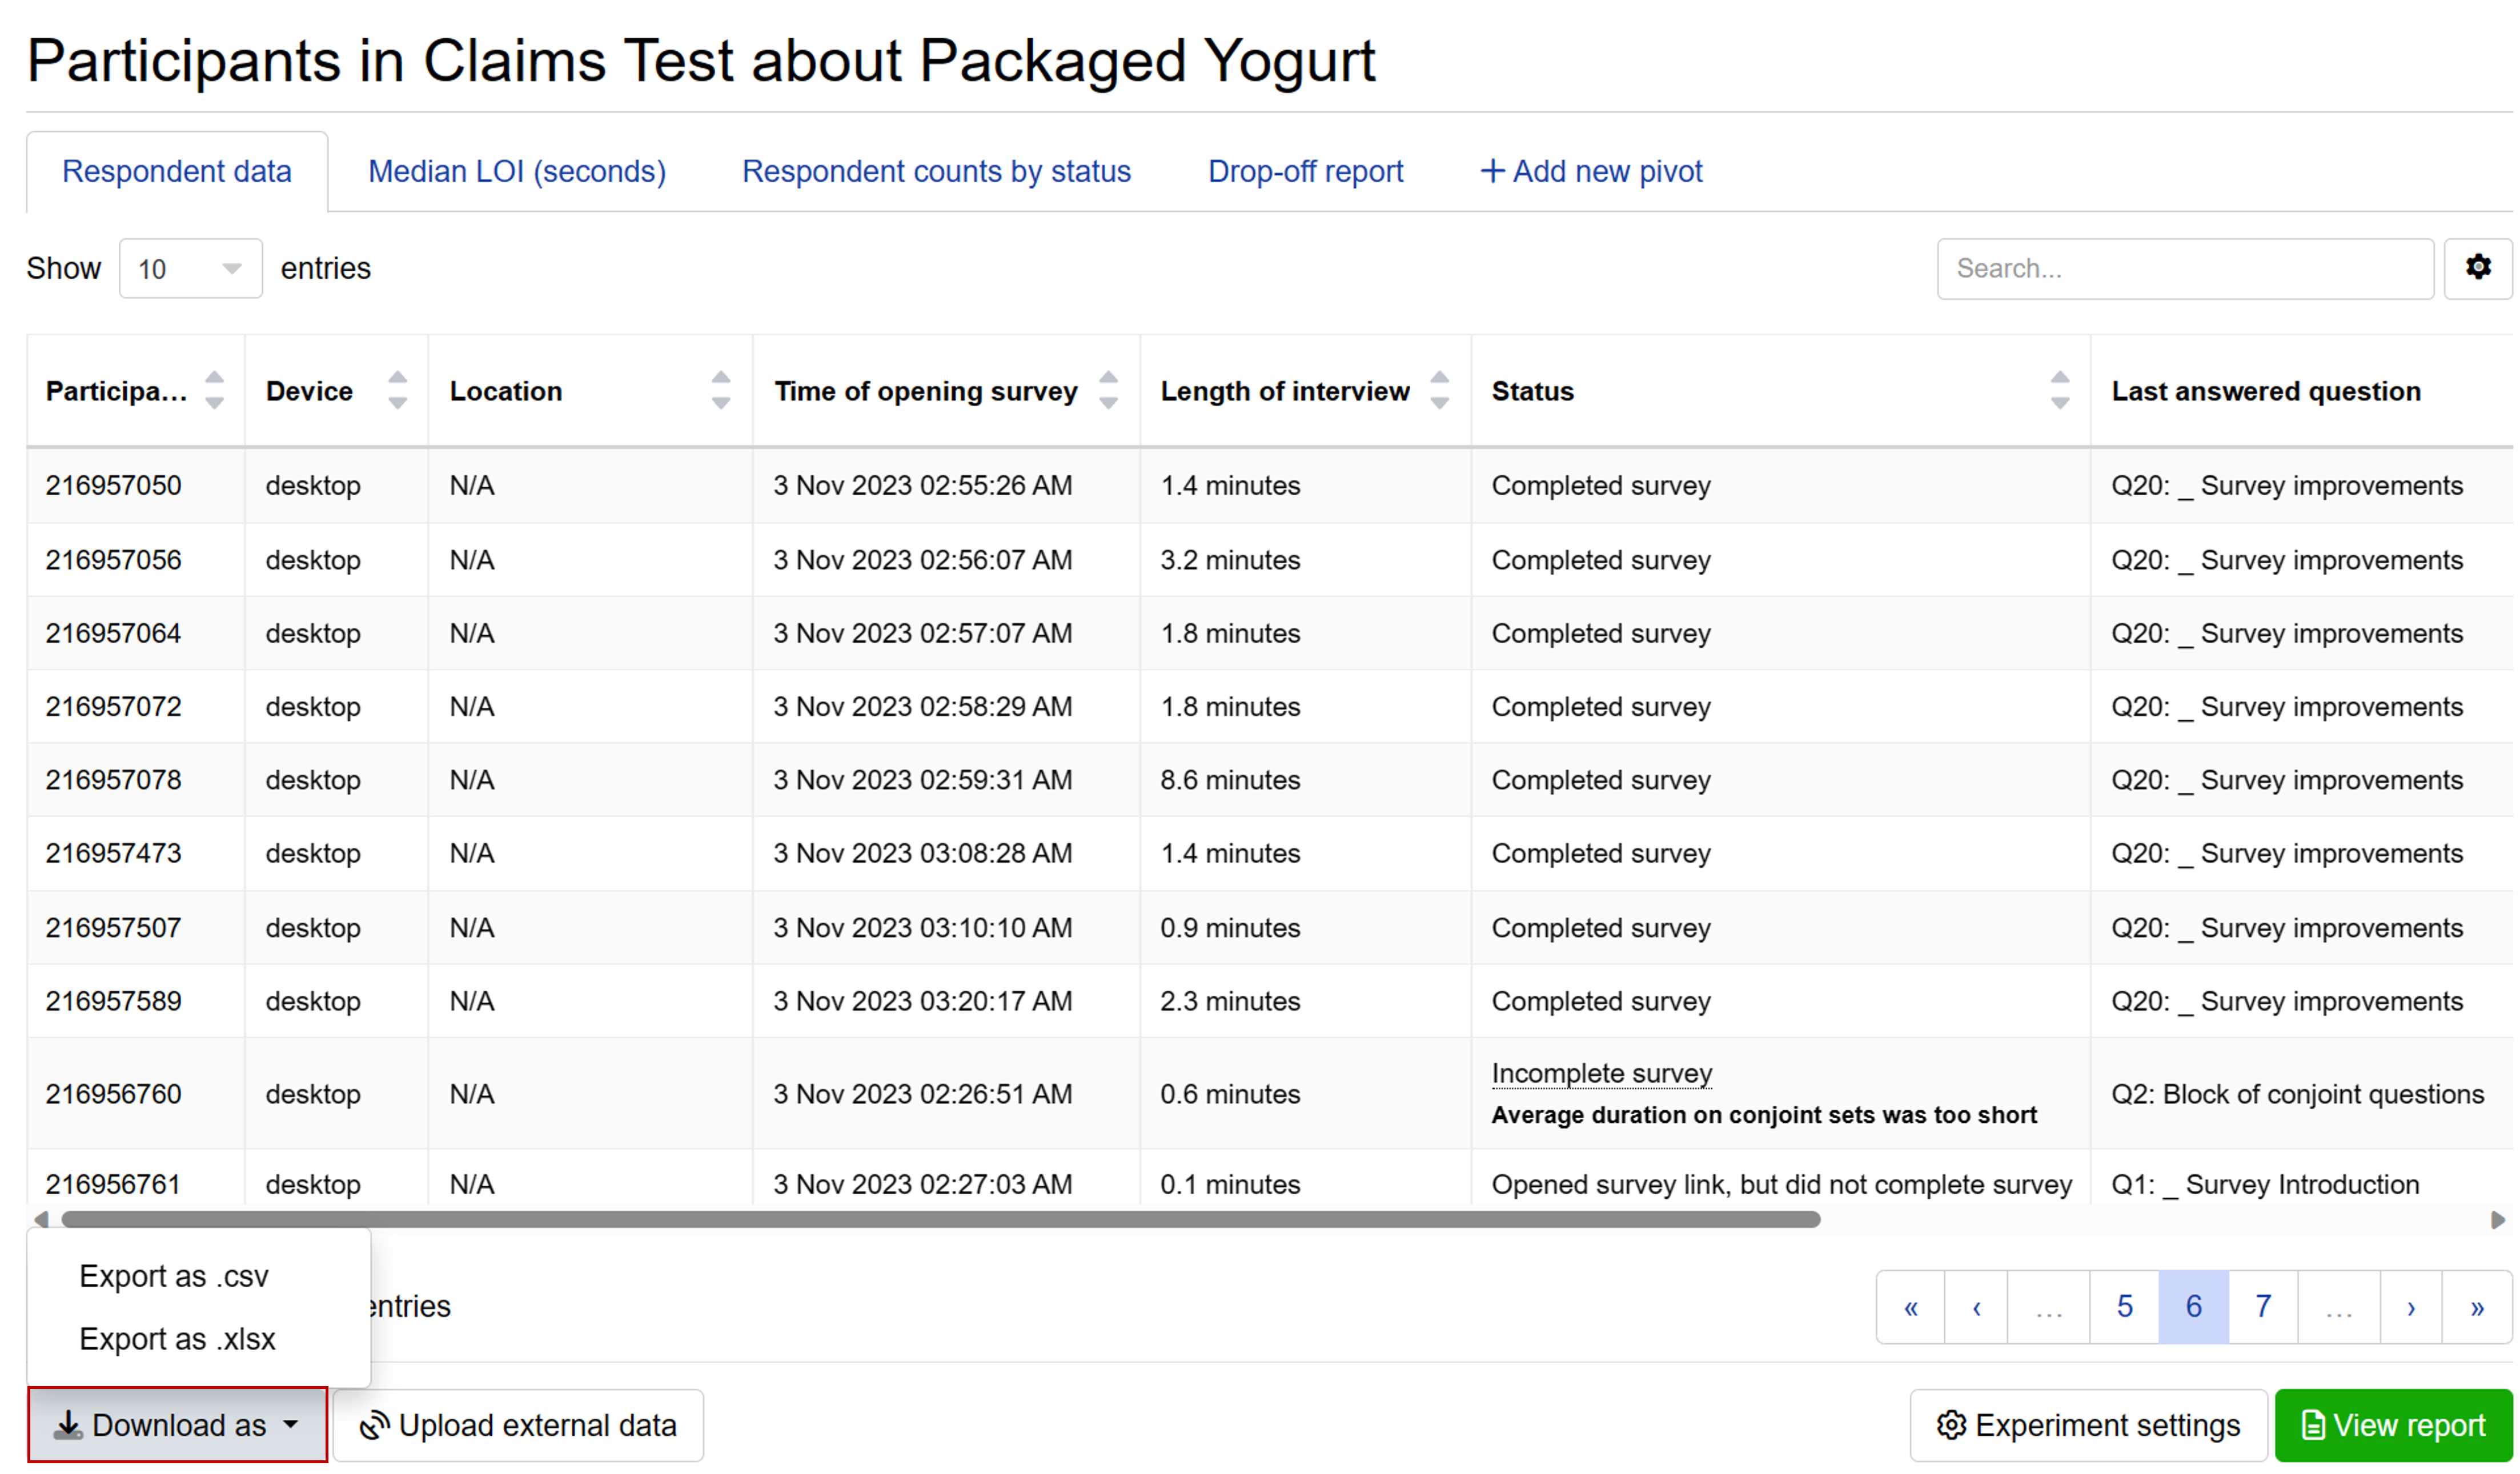
To export respondent data into a .csv or .xlsx file, click on the button on the bottom-left of the page.
